European vs Immigrants from Honduras In Labor Force | Age 20-64
COMPARE
European
Immigrants from Honduras
In Labor Force | Age 20-64
In Labor Force | Age 20-64 Comparison
Europeans
Immigrants from Honduras
79.3%
IN LABOR FORCE | AGE 20-64
15.3/ 100
METRIC RATING
211th/ 347
METRIC RANK
78.7%
IN LABOR FORCE | AGE 20-64
0.6/ 100
METRIC RATING
252nd/ 347
METRIC RANK
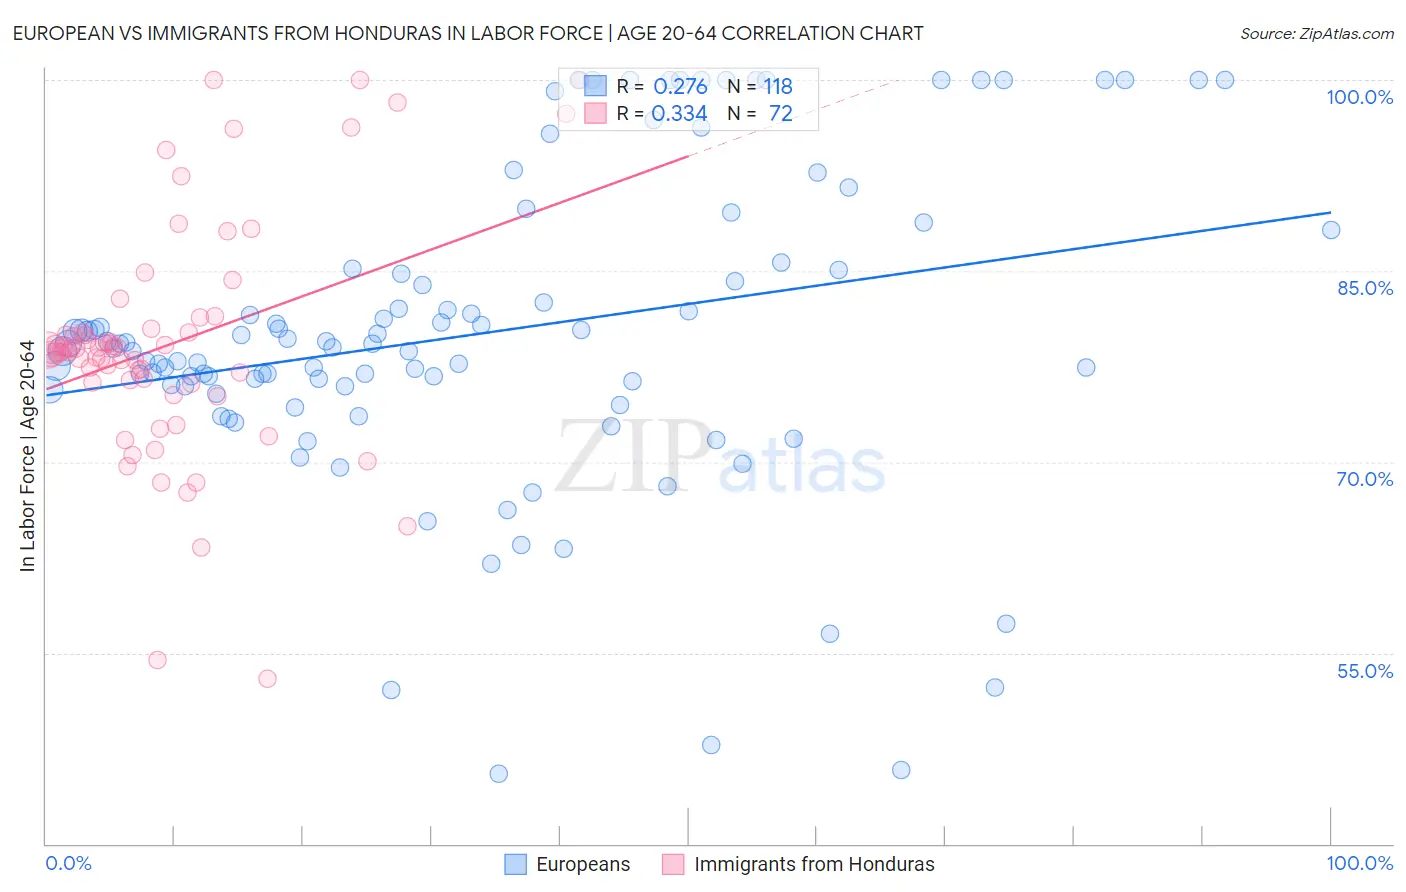
European vs Immigrants from Honduras In Labor Force | Age 20-64 Correlation Chart
The statistical analysis conducted on geographies consisting of 561,836,944 people shows a weak positive correlation between the proportion of Europeans and labor force participation rate among population between the ages 20 and 64 in the United States with a correlation coefficient (R) of 0.276 and weighted average of 79.3%. Similarly, the statistical analysis conducted on geographies consisting of 322,602,752 people shows a mild positive correlation between the proportion of Immigrants from Honduras and labor force participation rate among population between the ages 20 and 64 in the United States with a correlation coefficient (R) of 0.334 and weighted average of 78.7%, a difference of 0.70%.
In Labor Force | Age 20-64 Correlation Summary
| Measurement | European | Immigrants from Honduras |
| Minimum | 45.5% | 53.0% |
| Maximum | 100.0% | 100.0% |
| Range | 54.5% | 47.0% |
| Mean | 80.1% | 79.2% |
| Median | 79.1% | 78.7% |
| Interquartile 25% (IQ1) | 76.0% | 76.2% |
| Interquartile 75% (IQ3) | 85.1% | 80.3% |
| Interquartile Range (IQR) | 9.1% | 4.1% |
| Standard Deviation (Sample) | 12.1% | 9.2% |
| Standard Deviation (Population) | 12.1% | 9.2% |
Similar Demographics by In Labor Force | Age 20-64
Demographics Similar to Europeans by In Labor Force | Age 20-64
In terms of in labor force | age 20-64, the demographic groups most similar to Europeans are Haitian (79.3%, a difference of 0.010%), Immigrants from Ecuador (79.3%, a difference of 0.020%), Subsaharan African (79.3%, a difference of 0.020%), British (79.3%, a difference of 0.020%), and Bangladeshi (79.3%, a difference of 0.020%).
| Demographics | Rating | Rank | In Labor Force | Age 20-64 |
| Immigrants | Cambodia | 17.6 /100 | #204 | Poor 79.3% |
| Immigrants | Congo | 17.5 /100 | #205 | Poor 79.3% |
| Immigrants | Ecuador | 16.9 /100 | #206 | Poor 79.3% |
| Sub-Saharan Africans | 16.5 /100 | #207 | Poor 79.3% |
| British | 16.5 /100 | #208 | Poor 79.3% |
| Bangladeshis | 16.4 /100 | #209 | Poor 79.3% |
| Haitians | 16.1 /100 | #210 | Poor 79.3% |
| Europeans | 15.3 /100 | #211 | Poor 79.3% |
| Irish | 13.2 /100 | #212 | Poor 79.3% |
| Immigrants | Portugal | 12.8 /100 | #213 | Poor 79.3% |
| Immigrants | Armenia | 12.2 /100 | #214 | Poor 79.2% |
| Immigrants | Norway | 12.0 /100 | #215 | Poor 79.2% |
| Arabs | 11.4 /100 | #216 | Poor 79.2% |
| Immigrants | Western Asia | 11.0 /100 | #217 | Poor 79.2% |
| Immigrants | England | 9.3 /100 | #218 | Tragic 79.2% |
Demographics Similar to Immigrants from Honduras by In Labor Force | Age 20-64
In terms of in labor force | age 20-64, the demographic groups most similar to Immigrants from Honduras are Basque (78.7%, a difference of 0.010%), Immigrants from Lebanon (78.7%, a difference of 0.010%), Hawaiian (78.7%, a difference of 0.030%), Celtic (78.7%, a difference of 0.040%), and Barbadian (78.8%, a difference of 0.050%).
| Demographics | Rating | Rank | In Labor Force | Age 20-64 |
| Scottish | 1.3 /100 | #245 | Tragic 78.9% |
| Immigrants | Trinidad and Tobago | 1.1 /100 | #246 | Tragic 78.8% |
| Immigrants | Germany | 1.0 /100 | #247 | Tragic 78.8% |
| Immigrants | Caribbean | 1.0 /100 | #248 | Tragic 78.8% |
| English | 0.9 /100 | #249 | Tragic 78.8% |
| Hondurans | 0.8 /100 | #250 | Tragic 78.8% |
| Barbadians | 0.7 /100 | #251 | Tragic 78.8% |
| Immigrants | Honduras | 0.6 /100 | #252 | Tragic 78.7% |
| Basques | 0.5 /100 | #253 | Tragic 78.7% |
| Immigrants | Lebanon | 0.5 /100 | #254 | Tragic 78.7% |
| Hawaiians | 0.5 /100 | #255 | Tragic 78.7% |
| Celtics | 0.5 /100 | #256 | Tragic 78.7% |
| Guatemalans | 0.4 /100 | #257 | Tragic 78.7% |
| Immigrants | Guatemala | 0.4 /100 | #258 | Tragic 78.7% |
| Tsimshian | 0.4 /100 | #259 | Tragic 78.7% |