European vs Immigrants from Bahamas Male Disability
COMPARE
European
Immigrants from Bahamas
Male Disability
Male Disability Comparison
Europeans
Immigrants from Bahamas
12.1%
MALE DISABILITY
0.3/ 100
METRIC RATING
257th/ 347
METRIC RANK
11.7%
MALE DISABILITY
3.2/ 100
METRIC RATING
223rd/ 347
METRIC RANK
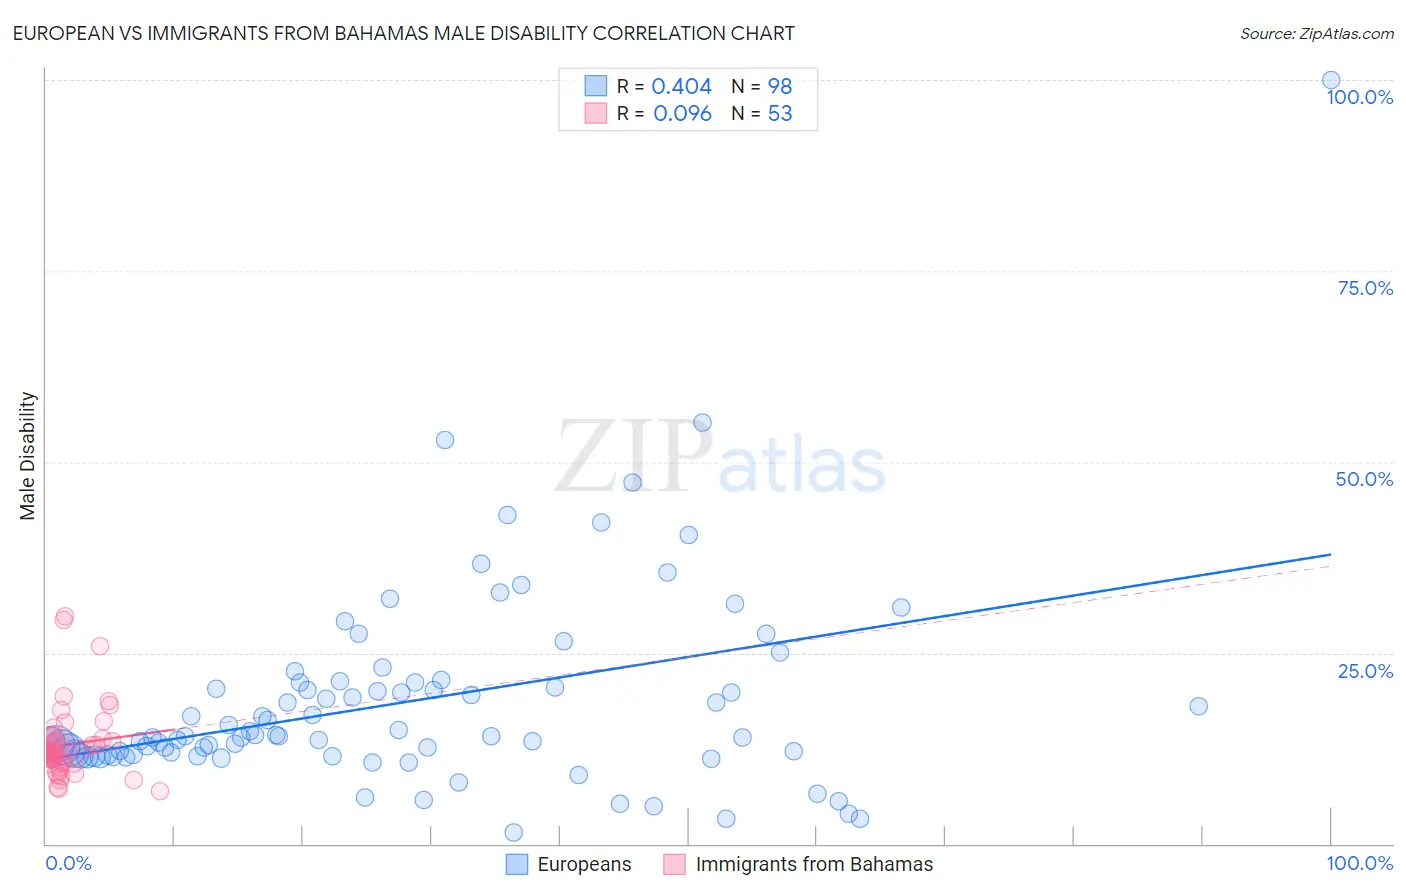
European vs Immigrants from Bahamas Male Disability Correlation Chart
The statistical analysis conducted on geographies consisting of 561,596,268 people shows a moderate positive correlation between the proportion of Europeans and percentage of males with a disability in the United States with a correlation coefficient (R) of 0.404 and weighted average of 12.1%. Similarly, the statistical analysis conducted on geographies consisting of 104,654,023 people shows a slight positive correlation between the proportion of Immigrants from Bahamas and percentage of males with a disability in the United States with a correlation coefficient (R) of 0.096 and weighted average of 11.7%, a difference of 2.9%.
Male Disability Correlation Summary
| Measurement | European | Immigrants from Bahamas |
| Minimum | 1.4% | 6.9% |
| Maximum | 100.0% | 29.9% |
| Range | 98.6% | 23.0% |
| Mean | 18.6% | 13.0% |
| Median | 14.0% | 11.9% |
| Interquartile 25% (IQ1) | 11.6% | 10.7% |
| Interquartile 75% (IQ3) | 21.1% | 13.6% |
| Interquartile Range (IQR) | 9.4% | 3.0% |
| Standard Deviation (Sample) | 13.4% | 4.7% |
| Standard Deviation (Population) | 13.3% | 4.6% |
Similar Demographics by Male Disability
Demographics Similar to Europeans by Male Disability
In terms of male disability, the demographic groups most similar to Europeans are Swiss (12.1%, a difference of 0.0%), Basque (12.1%, a difference of 0.19%), Belgian (12.1%, a difference of 0.24%), Chinese (12.1%, a difference of 0.25%), and British (12.1%, a difference of 0.26%).
| Demographics | Rating | Rank | Male Disability |
| Bangladeshis | 0.5 /100 | #250 | Tragic 12.0% |
| German Russians | 0.5 /100 | #251 | Tragic 12.0% |
| Slovenes | 0.5 /100 | #252 | Tragic 12.0% |
| Guamanians/Chamorros | 0.5 /100 | #253 | Tragic 12.0% |
| British | 0.4 /100 | #254 | Tragic 12.1% |
| Chinese | 0.4 /100 | #255 | Tragic 12.1% |
| Swiss | 0.3 /100 | #256 | Tragic 12.1% |
| Europeans | 0.3 /100 | #257 | Tragic 12.1% |
| Basques | 0.3 /100 | #258 | Tragic 12.1% |
| Belgians | 0.3 /100 | #259 | Tragic 12.1% |
| Swedes | 0.3 /100 | #260 | Tragic 12.1% |
| Slavs | 0.2 /100 | #261 | Tragic 12.2% |
| Norwegians | 0.2 /100 | #262 | Tragic 12.2% |
| Canadians | 0.2 /100 | #263 | Tragic 12.2% |
| Nepalese | 0.2 /100 | #264 | Tragic 12.2% |
Demographics Similar to Immigrants from Bahamas by Male Disability
In terms of male disability, the demographic groups most similar to Immigrants from Bahamas are Japanese (11.7%, a difference of 0.020%), Liberian (11.8%, a difference of 0.030%), Alsatian (11.7%, a difference of 0.080%), Subsaharan African (11.8%, a difference of 0.15%), and Immigrants from Congo (11.7%, a difference of 0.24%).
| Demographics | Rating | Rank | Male Disability |
| Immigrants | Dominican Republic | 4.9 /100 | #216 | Tragic 11.7% |
| Immigrants | Dominica | 4.6 /100 | #217 | Tragic 11.7% |
| Immigrants | England | 4.0 /100 | #218 | Tragic 11.7% |
| Panamanians | 3.8 /100 | #219 | Tragic 11.7% |
| Immigrants | Western Europe | 3.8 /100 | #220 | Tragic 11.7% |
| Immigrants | Congo | 3.7 /100 | #221 | Tragic 11.7% |
| Alsatians | 3.3 /100 | #222 | Tragic 11.7% |
| Immigrants | Bahamas | 3.2 /100 | #223 | Tragic 11.7% |
| Japanese | 3.1 /100 | #224 | Tragic 11.7% |
| Liberians | 3.1 /100 | #225 | Tragic 11.8% |
| Sub-Saharan Africans | 2.8 /100 | #226 | Tragic 11.8% |
| Austrians | 2.5 /100 | #227 | Tragic 11.8% |
| Hispanics or Latinos | 2.3 /100 | #228 | Tragic 11.8% |
| Bermudans | 2.3 /100 | #229 | Tragic 11.8% |
| Croatians | 2.1 /100 | #230 | Tragic 11.8% |