Immigrants from Cabo Verde vs Spaniard Seniors Poverty Over the Age of 75
COMPARE
Immigrants from Cabo Verde
Spaniard
Seniors Poverty Over the Age of 75
Seniors Poverty Over the Age of 75 Comparison
Immigrants from Cabo Verde
Spaniards
18.5%
SENIORS POVERTY OVER THE AGE OF 75
0.0/ 100
METRIC RATING
338th/ 347
METRIC RANK
12.2%
SENIORS POVERTY OVER THE AGE OF 75
51.6/ 100
METRIC RATING
171st/ 347
METRIC RANK
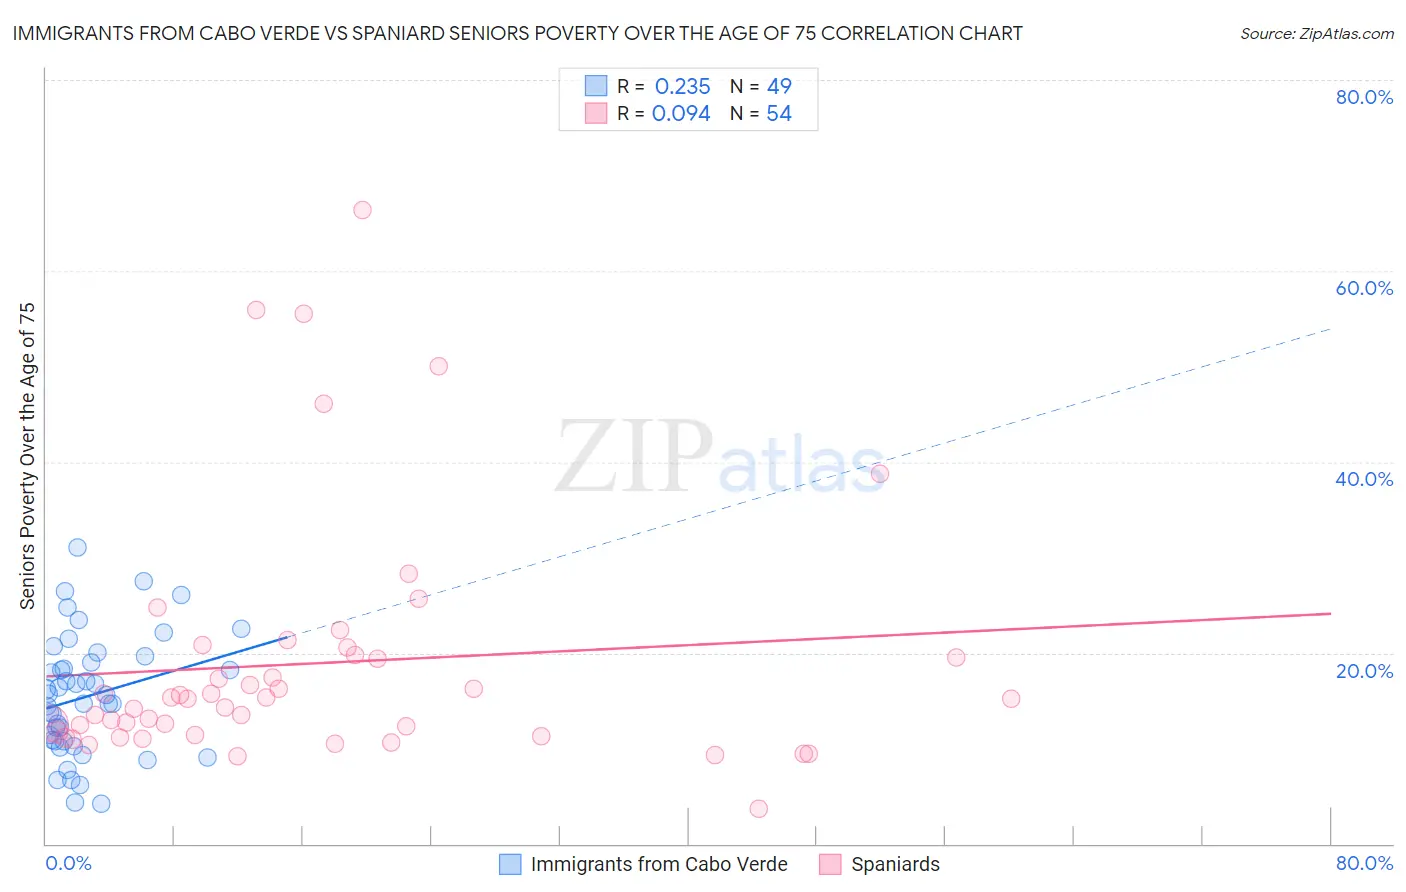
Immigrants from Cabo Verde vs Spaniard Seniors Poverty Over the Age of 75 Correlation Chart
The statistical analysis conducted on geographies consisting of 37,992,764 people shows a weak positive correlation between the proportion of Immigrants from Cabo Verde and poverty level among seniors over the age of 75 in the United States with a correlation coefficient (R) of 0.235 and weighted average of 18.5%. Similarly, the statistical analysis conducted on geographies consisting of 437,059,242 people shows a slight positive correlation between the proportion of Spaniards and poverty level among seniors over the age of 75 in the United States with a correlation coefficient (R) of 0.094 and weighted average of 12.2%, a difference of 51.9%.
Seniors Poverty Over the Age of 75 Correlation Summary
| Measurement | Immigrants from Cabo Verde | Spaniard |
| Minimum | 4.3% | 3.6% |
| Maximum | 31.1% | 66.4% |
| Range | 26.8% | 62.8% |
| Mean | 15.5% | 18.9% |
| Median | 15.6% | 15.2% |
| Interquartile 25% (IQ1) | 10.8% | 11.4% |
| Interquartile 75% (IQ3) | 19.3% | 19.8% |
| Interquartile Range (IQR) | 8.6% | 8.4% |
| Standard Deviation (Sample) | 6.2% | 13.0% |
| Standard Deviation (Population) | 6.2% | 12.9% |
Similar Demographics by Seniors Poverty Over the Age of 75
Demographics Similar to Immigrants from Cabo Verde by Seniors Poverty Over the Age of 75
In terms of seniors poverty over the age of 75, the demographic groups most similar to Immigrants from Cabo Verde are Yakama (18.3%, a difference of 0.97%), Immigrants from Caribbean (18.2%, a difference of 1.4%), Hopi (18.9%, a difference of 2.0%), Cuban (18.0%, a difference of 3.0%), and Tohono O'odham (19.1%, a difference of 3.5%).
| Demographics | Rating | Rank | Seniors Poverty Over the Age of 75 |
| Immigrants | Armenia | 0.0 /100 | #331 | Tragic 17.5% |
| Immigrants | St. Vincent and the Grenadines | 0.0 /100 | #332 | Tragic 17.5% |
| Immigrants | Nicaragua | 0.0 /100 | #333 | Tragic 17.6% |
| Immigrants | Grenada | 0.0 /100 | #334 | Tragic 17.8% |
| Cubans | 0.0 /100 | #335 | Tragic 18.0% |
| Immigrants | Caribbean | 0.0 /100 | #336 | Tragic 18.2% |
| Yakama | 0.0 /100 | #337 | Tragic 18.3% |
| Immigrants | Cabo Verde | 0.0 /100 | #338 | Tragic 18.5% |
| Hopi | 0.0 /100 | #339 | Tragic 18.9% |
| Tohono O'odham | 0.0 /100 | #340 | Tragic 19.1% |
| Navajo | 0.0 /100 | #341 | Tragic 19.4% |
| Dominicans | 0.0 /100 | #342 | Tragic 19.6% |
| Lumbee | 0.0 /100 | #343 | Tragic 19.7% |
| Immigrants | Cuba | 0.0 /100 | #344 | Tragic 19.9% |
| Immigrants | Dominican Republic | 0.0 /100 | #345 | Tragic 20.1% |
Demographics Similar to Spaniards by Seniors Poverty Over the Age of 75
In terms of seniors poverty over the age of 75, the demographic groups most similar to Spaniards are Immigrants from Fiji (12.2%, a difference of 0.010%), Immigrants from Thailand (12.2%, a difference of 0.030%), Arab (12.2%, a difference of 0.090%), Immigrants from Europe (12.2%, a difference of 0.13%), and Immigrants from Saudi Arabia (12.2%, a difference of 0.17%).
| Demographics | Rating | Rank | Seniors Poverty Over the Age of 75 |
| Potawatomi | 57.4 /100 | #164 | Average 12.1% |
| Okinawans | 56.3 /100 | #165 | Average 12.1% |
| Egyptians | 54.8 /100 | #166 | Average 12.1% |
| Immigrants | Switzerland | 54.5 /100 | #167 | Average 12.1% |
| Immigrants | Syria | 53.9 /100 | #168 | Average 12.2% |
| Immigrants | Egypt | 53.7 /100 | #169 | Average 12.2% |
| Immigrants | Thailand | 52.0 /100 | #170 | Average 12.2% |
| Spaniards | 51.6 /100 | #171 | Average 12.2% |
| Immigrants | Fiji | 51.5 /100 | #172 | Average 12.2% |
| Arabs | 50.5 /100 | #173 | Average 12.2% |
| Immigrants | Europe | 50.0 /100 | #174 | Average 12.2% |
| Immigrants | Saudi Arabia | 49.5 /100 | #175 | Average 12.2% |
| Immigrants | Iran | 48.1 /100 | #176 | Average 12.2% |
| Immigrants | Asia | 47.8 /100 | #177 | Average 12.2% |
| Immigrants | Nonimmigrants | 46.8 /100 | #178 | Average 12.2% |