Cambodian vs Spaniard Seniors Poverty Over the Age of 75
COMPARE
Cambodian
Spaniard
Seniors Poverty Over the Age of 75
Seniors Poverty Over the Age of 75 Comparison
Cambodians
Spaniards
12.0%
SENIORS POVERTY OVER THE AGE OF 75
64.0/ 100
METRIC RATING
154th/ 347
METRIC RANK
12.2%
SENIORS POVERTY OVER THE AGE OF 75
51.6/ 100
METRIC RATING
171st/ 347
METRIC RANK
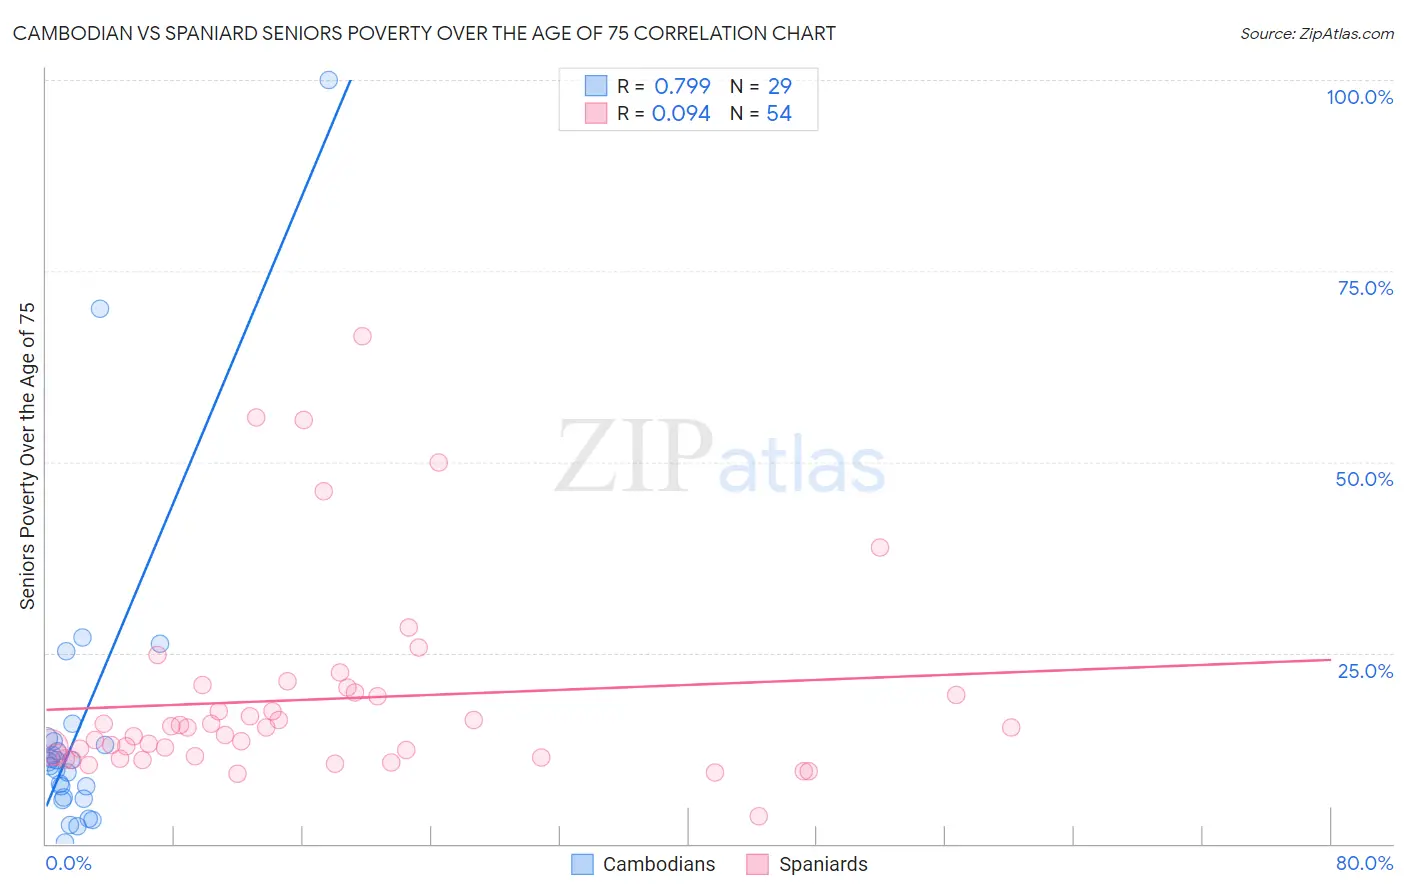
Cambodian vs Spaniard Seniors Poverty Over the Age of 75 Correlation Chart
The statistical analysis conducted on geographies consisting of 102,059,315 people shows a strong positive correlation between the proportion of Cambodians and poverty level among seniors over the age of 75 in the United States with a correlation coefficient (R) of 0.799 and weighted average of 12.0%. Similarly, the statistical analysis conducted on geographies consisting of 437,059,242 people shows a slight positive correlation between the proportion of Spaniards and poverty level among seniors over the age of 75 in the United States with a correlation coefficient (R) of 0.094 and weighted average of 12.2%, a difference of 1.1%.
Seniors Poverty Over the Age of 75 Correlation Summary
| Measurement | Cambodian | Spaniard |
| Minimum | 0.12% | 3.6% |
| Maximum | 100.0% | 66.4% |
| Range | 99.9% | 62.8% |
| Mean | 15.6% | 18.9% |
| Median | 10.7% | 15.2% |
| Interquartile 25% (IQ1) | 6.0% | 11.4% |
| Interquartile 75% (IQ3) | 13.6% | 19.8% |
| Interquartile Range (IQR) | 7.5% | 8.4% |
| Standard Deviation (Sample) | 20.7% | 13.0% |
| Standard Deviation (Population) | 20.4% | 12.9% |
Demographics Similar to Cambodians and Spaniards by Seniors Poverty Over the Age of 75
In terms of seniors poverty over the age of 75, the demographic groups most similar to Cambodians are Immigrants from Turkey (12.0%, a difference of 0.060%), Indonesian (12.1%, a difference of 0.12%), Immigrants from Korea (12.0%, a difference of 0.14%), Immigrants from Burma/Myanmar (12.1%, a difference of 0.14%), and Immigrants from Sudan (12.1%, a difference of 0.20%). Similarly, the demographic groups most similar to Spaniards are Immigrants from Fiji (12.2%, a difference of 0.010%), Immigrants from Thailand (12.2%, a difference of 0.030%), Immigrants from Egypt (12.2%, a difference of 0.18%), Immigrants from Syria (12.2%, a difference of 0.19%), and Immigrants from Switzerland (12.1%, a difference of 0.24%).
| Demographics | Rating | Rank | Seniors Poverty Over the Age of 75 |
| Immigrants | Korea | 65.5 /100 | #152 | Good 12.0% |
| Immigrants | Turkey | 64.7 /100 | #153 | Good 12.0% |
| Cambodians | 64.0 /100 | #154 | Good 12.0% |
| Indonesians | 62.6 /100 | #155 | Good 12.1% |
| Immigrants | Burma/Myanmar | 62.3 /100 | #156 | Good 12.1% |
| Immigrants | Sudan | 61.7 /100 | #157 | Good 12.1% |
| Portuguese | 61.3 /100 | #158 | Good 12.1% |
| Immigrants | Middle Africa | 61.2 /100 | #159 | Good 12.1% |
| Immigrants | Eastern Africa | 60.9 /100 | #160 | Good 12.1% |
| Immigrants | Norway | 60.6 /100 | #161 | Good 12.1% |
| Immigrants | Serbia | 60.2 /100 | #162 | Good 12.1% |
| Immigrants | Greece | 58.2 /100 | #163 | Average 12.1% |
| Potawatomi | 57.4 /100 | #164 | Average 12.1% |
| Okinawans | 56.3 /100 | #165 | Average 12.1% |
| Egyptians | 54.8 /100 | #166 | Average 12.1% |
| Immigrants | Switzerland | 54.5 /100 | #167 | Average 12.1% |
| Immigrants | Syria | 53.9 /100 | #168 | Average 12.2% |
| Immigrants | Egypt | 53.7 /100 | #169 | Average 12.2% |
| Immigrants | Thailand | 52.0 /100 | #170 | Average 12.2% |
| Spaniards | 51.6 /100 | #171 | Average 12.2% |
| Immigrants | Fiji | 51.5 /100 | #172 | Average 12.2% |