Danish vs Immigrants from Saudi Arabia Female Poverty Among 18-24 Year Olds
COMPARE
Danish
Immigrants from Saudi Arabia
Female Poverty Among 18-24 Year Olds
Female Poverty Among 18-24 Year Olds Comparison
Danes
Immigrants from Saudi Arabia
19.8%
FEMALE POVERTY AMONG 18-24 YEAR OLDS
75.5/ 100
METRIC RATING
157th/ 347
METRIC RANK
25.3%
FEMALE POVERTY AMONG 18-24 YEAR OLDS
0.0/ 100
METRIC RATING
325th/ 347
METRIC RANK
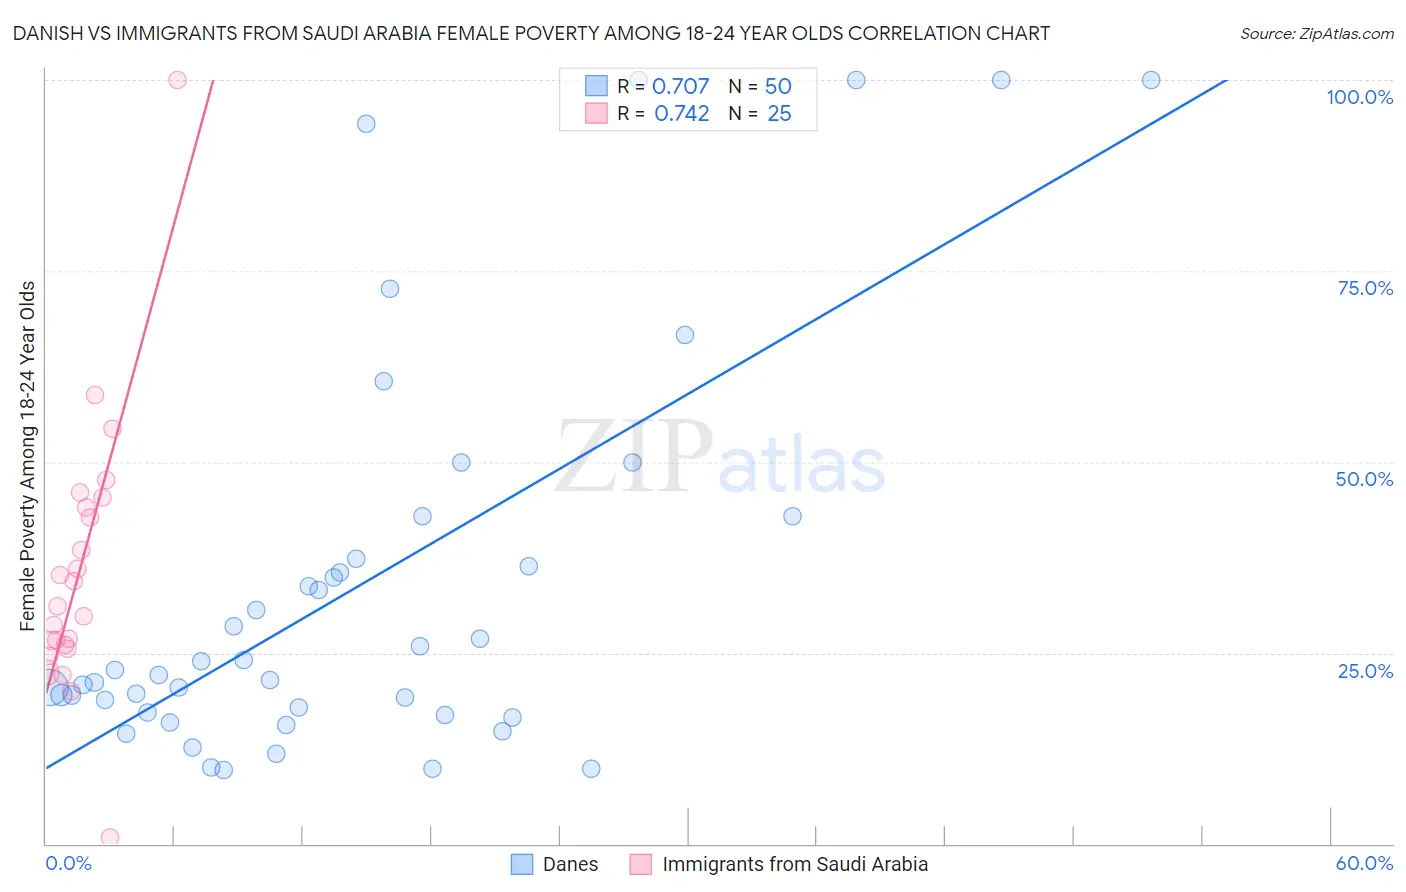
Danish vs Immigrants from Saudi Arabia Female Poverty Among 18-24 Year Olds Correlation Chart
The statistical analysis conducted on geographies consisting of 454,175,861 people shows a strong positive correlation between the proportion of Danes and poverty level among females between the ages 18 and 24 in the United States with a correlation coefficient (R) of 0.707 and weighted average of 19.8%. Similarly, the statistical analysis conducted on geographies consisting of 163,276,654 people shows a strong positive correlation between the proportion of Immigrants from Saudi Arabia and poverty level among females between the ages 18 and 24 in the United States with a correlation coefficient (R) of 0.742 and weighted average of 25.3%, a difference of 27.5%.
Female Poverty Among 18-24 Year Olds Correlation Summary
| Measurement | Danish | Immigrants from Saudi Arabia |
| Minimum | 9.6% | 0.84% |
| Maximum | 100.0% | 100.0% |
| Range | 90.4% | 99.2% |
| Mean | 33.8% | 35.8% |
| Median | 22.4% | 31.1% |
| Interquartile 25% (IQ1) | 17.2% | 25.7% |
| Interquartile 75% (IQ3) | 37.4% | 44.7% |
| Interquartile Range (IQR) | 20.2% | 19.0% |
| Standard Deviation (Sample) | 26.1% | 18.2% |
| Standard Deviation (Population) | 25.9% | 17.9% |
Similar Demographics by Female Poverty Among 18-24 Year Olds
Demographics Similar to Danes by Female Poverty Among 18-24 Year Olds
In terms of female poverty among 18-24 year olds, the demographic groups most similar to Danes are Immigrants from Lebanon (19.8%, a difference of 0.020%), Immigrants from Belgium (19.8%, a difference of 0.060%), Hungarian (19.8%, a difference of 0.070%), Trinidadian and Tobagonian (19.8%, a difference of 0.070%), and Immigrants from Zimbabwe (19.8%, a difference of 0.080%).
| Demographics | Rating | Rank | Female Poverty Among 18-24 Year Olds |
| Syrians | 80.2 /100 | #150 | Excellent 19.8% |
| Immigrants | Eastern Asia | 79.7 /100 | #151 | Good 19.8% |
| Yugoslavians | 79.0 /100 | #152 | Good 19.8% |
| Immigrants | Japan | 78.1 /100 | #153 | Good 19.8% |
| Immigrants | Zimbabwe | 76.7 /100 | #154 | Good 19.8% |
| Hungarians | 76.6 /100 | #155 | Good 19.8% |
| Immigrants | Belgium | 76.4 /100 | #156 | Good 19.8% |
| Danes | 75.5 /100 | #157 | Good 19.8% |
| Immigrants | Lebanon | 75.3 /100 | #158 | Good 19.8% |
| Trinidadians and Tobagonians | 74.4 /100 | #159 | Good 19.8% |
| Pakistanis | 74.1 /100 | #160 | Good 19.8% |
| Immigrants | Belize | 74.1 /100 | #161 | Good 19.8% |
| French Canadians | 73.0 /100 | #162 | Good 19.9% |
| Malaysians | 72.7 /100 | #163 | Good 19.9% |
| Central Americans | 70.0 /100 | #164 | Good 19.9% |
Demographics Similar to Immigrants from Saudi Arabia by Female Poverty Among 18-24 Year Olds
In terms of female poverty among 18-24 year olds, the demographic groups most similar to Immigrants from Saudi Arabia are Yakama (25.3%, a difference of 0.25%), German Russian (25.2%, a difference of 0.43%), Arapaho (25.2%, a difference of 0.46%), Ute (25.4%, a difference of 0.48%), and Somali (25.1%, a difference of 0.53%).
| Demographics | Rating | Rank | Female Poverty Among 18-24 Year Olds |
| Chickasaw | 0.0 /100 | #318 | Tragic 24.5% |
| Dutch West Indians | 0.0 /100 | #319 | Tragic 24.5% |
| Immigrants | Congo | 0.0 /100 | #320 | Tragic 24.6% |
| Immigrants | Zaire | 0.0 /100 | #321 | Tragic 25.1% |
| Somalis | 0.0 /100 | #322 | Tragic 25.1% |
| Arapaho | 0.0 /100 | #323 | Tragic 25.2% |
| German Russians | 0.0 /100 | #324 | Tragic 25.2% |
| Immigrants | Saudi Arabia | 0.0 /100 | #325 | Tragic 25.3% |
| Yakama | 0.0 /100 | #326 | Tragic 25.3% |
| Ute | 0.0 /100 | #327 | Tragic 25.4% |
| Natives/Alaskans | 0.0 /100 | #328 | Tragic 25.4% |
| Cajuns | 0.0 /100 | #329 | Tragic 25.7% |
| Immigrants | Somalia | 0.0 /100 | #330 | Tragic 25.7% |
| Chippewa | 0.0 /100 | #331 | Tragic 25.9% |
| Houma | 0.0 /100 | #332 | Tragic 26.2% |