Estonian vs Liberian Female Poverty Among 18-24 Year Olds
COMPARE
Estonian
Liberian
Female Poverty Among 18-24 Year Olds
Female Poverty Among 18-24 Year Olds Comparison
Estonians
Liberians
20.7%
FEMALE POVERTY AMONG 18-24 YEAR OLDS
7.2/ 100
METRIC RATING
226th/ 347
METRIC RANK
20.6%
FEMALE POVERTY AMONG 18-24 YEAR OLDS
11.6/ 100
METRIC RATING
212th/ 347
METRIC RANK
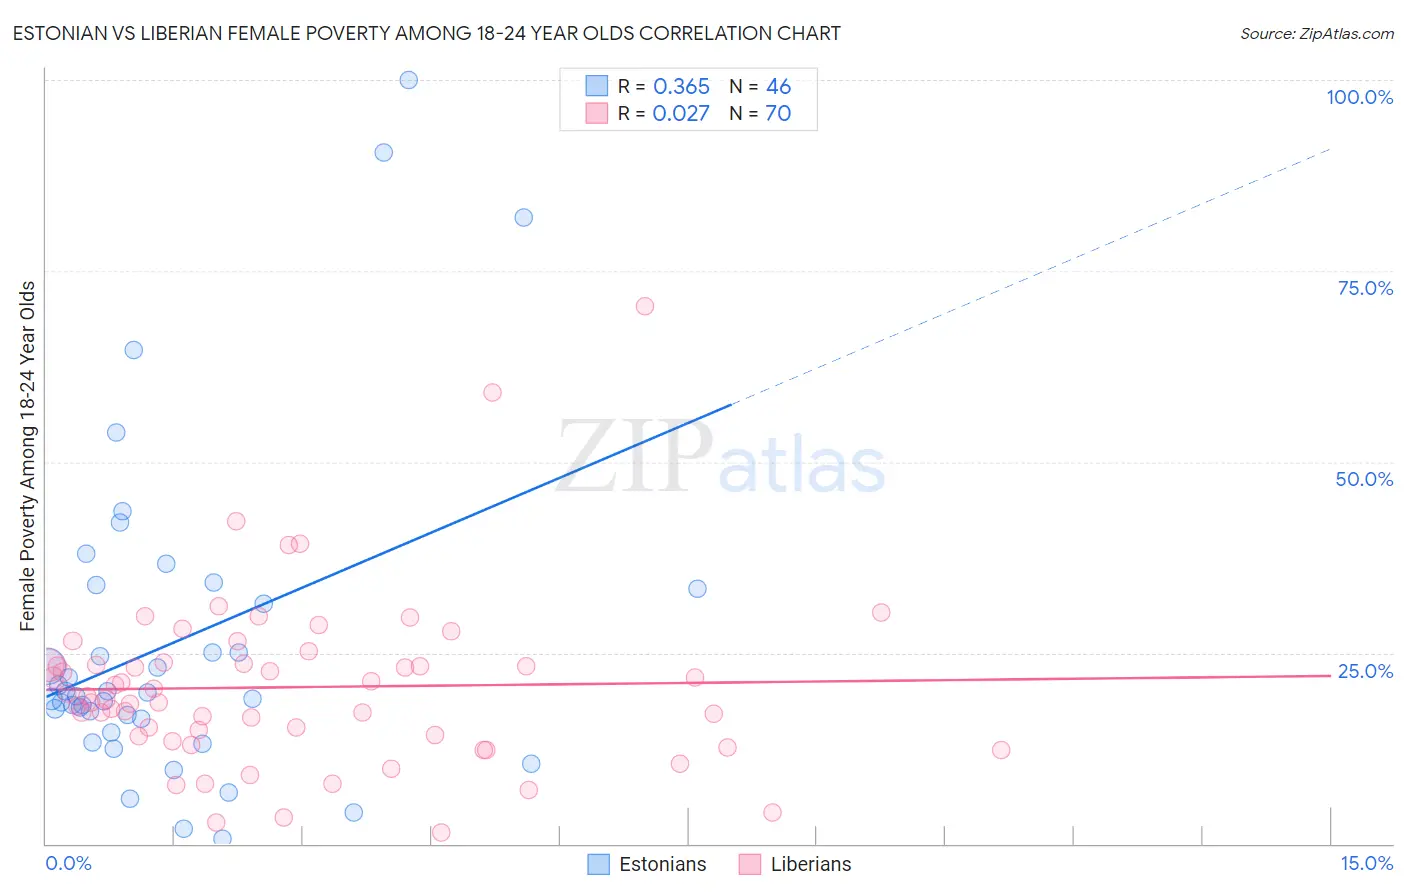
Estonian vs Liberian Female Poverty Among 18-24 Year Olds Correlation Chart
The statistical analysis conducted on geographies consisting of 122,061,434 people shows a mild positive correlation between the proportion of Estonians and poverty level among females between the ages 18 and 24 in the United States with a correlation coefficient (R) of 0.365 and weighted average of 20.7%. Similarly, the statistical analysis conducted on geographies consisting of 117,354,593 people shows no correlation between the proportion of Liberians and poverty level among females between the ages 18 and 24 in the United States with a correlation coefficient (R) of 0.027 and weighted average of 20.6%, a difference of 0.64%.
Female Poverty Among 18-24 Year Olds Correlation Summary
| Measurement | Estonian | Liberian |
| Minimum | 0.60% | 1.5% |
| Maximum | 100.0% | 70.3% |
| Range | 99.4% | 68.8% |
| Mean | 26.4% | 20.5% |
| Median | 19.5% | 19.1% |
| Interquartile 25% (IQ1) | 16.4% | 14.1% |
| Interquartile 75% (IQ3) | 33.3% | 23.6% |
| Interquartile Range (IQR) | 17.0% | 9.5% |
| Standard Deviation (Sample) | 21.4% | 11.3% |
| Standard Deviation (Population) | 21.2% | 11.3% |
Demographics Similar to Estonians and Liberians by Female Poverty Among 18-24 Year Olds
In terms of female poverty among 18-24 year olds, the demographic groups most similar to Estonians are Norwegian (20.7%, a difference of 0.020%), Immigrants from Sweden (20.7%, a difference of 0.070%), Immigrants from Liberia (20.7%, a difference of 0.080%), French (20.7%, a difference of 0.13%), and Ghanaian (20.8%, a difference of 0.13%). Similarly, the demographic groups most similar to Liberians are Northern European (20.6%, a difference of 0.010%), Immigrants from South Africa (20.6%, a difference of 0.12%), Spanish (20.6%, a difference of 0.15%), Immigrants from Western Africa (20.6%, a difference of 0.17%), and Immigrants from Western Europe (20.6%, a difference of 0.21%).
| Demographics | Rating | Rank | Female Poverty Among 18-24 Year Olds |
| Arabs | 15.5 /100 | #209 | Poor 20.5% |
| Immigrants | Ghana | 14.3 /100 | #210 | Poor 20.5% |
| Immigrants | Western Europe | 13.5 /100 | #211 | Poor 20.6% |
| Liberians | 11.6 /100 | #212 | Poor 20.6% |
| Northern Europeans | 11.6 /100 | #213 | Poor 20.6% |
| Immigrants | South Africa | 10.7 /100 | #214 | Poor 20.6% |
| Spanish | 10.4 /100 | #215 | Poor 20.6% |
| Immigrants | Western Africa | 10.2 /100 | #216 | Poor 20.6% |
| Immigrants | Laos | 9.7 /100 | #217 | Tragic 20.6% |
| Immigrants | Nepal | 9.6 /100 | #218 | Tragic 20.7% |
| Immigrants | Micronesia | 9.6 /100 | #219 | Tragic 20.7% |
| British | 9.4 /100 | #220 | Tragic 20.7% |
| Barbadians | 9.0 /100 | #221 | Tragic 20.7% |
| Guatemalans | 8.1 /100 | #222 | Tragic 20.7% |
| French | 7.9 /100 | #223 | Tragic 20.7% |
| Immigrants | Liberia | 7.6 /100 | #224 | Tragic 20.7% |
| Norwegians | 7.3 /100 | #225 | Tragic 20.7% |
| Estonians | 7.2 /100 | #226 | Tragic 20.7% |
| Immigrants | Sweden | 6.8 /100 | #227 | Tragic 20.7% |
| Ghanaians | 6.5 /100 | #228 | Tragic 20.8% |
| Australians | 6.1 /100 | #229 | Tragic 20.8% |