Immigrants from South Africa vs Immigrants from Netherlands Child Poverty Under the Age of 5
COMPARE
Immigrants from South Africa
Immigrants from Netherlands
Child Poverty Under the Age of 5
Child Poverty Under the Age of 5 Comparison
Immigrants from South Africa
Immigrants from Netherlands
15.8%
CHILD POVERTY UNDER THE AGE OF 5
96.1/ 100
METRIC RATING
98th/ 347
METRIC RANK
15.6%
CHILD POVERTY UNDER THE AGE OF 5
97.6/ 100
METRIC RATING
84th/ 347
METRIC RANK
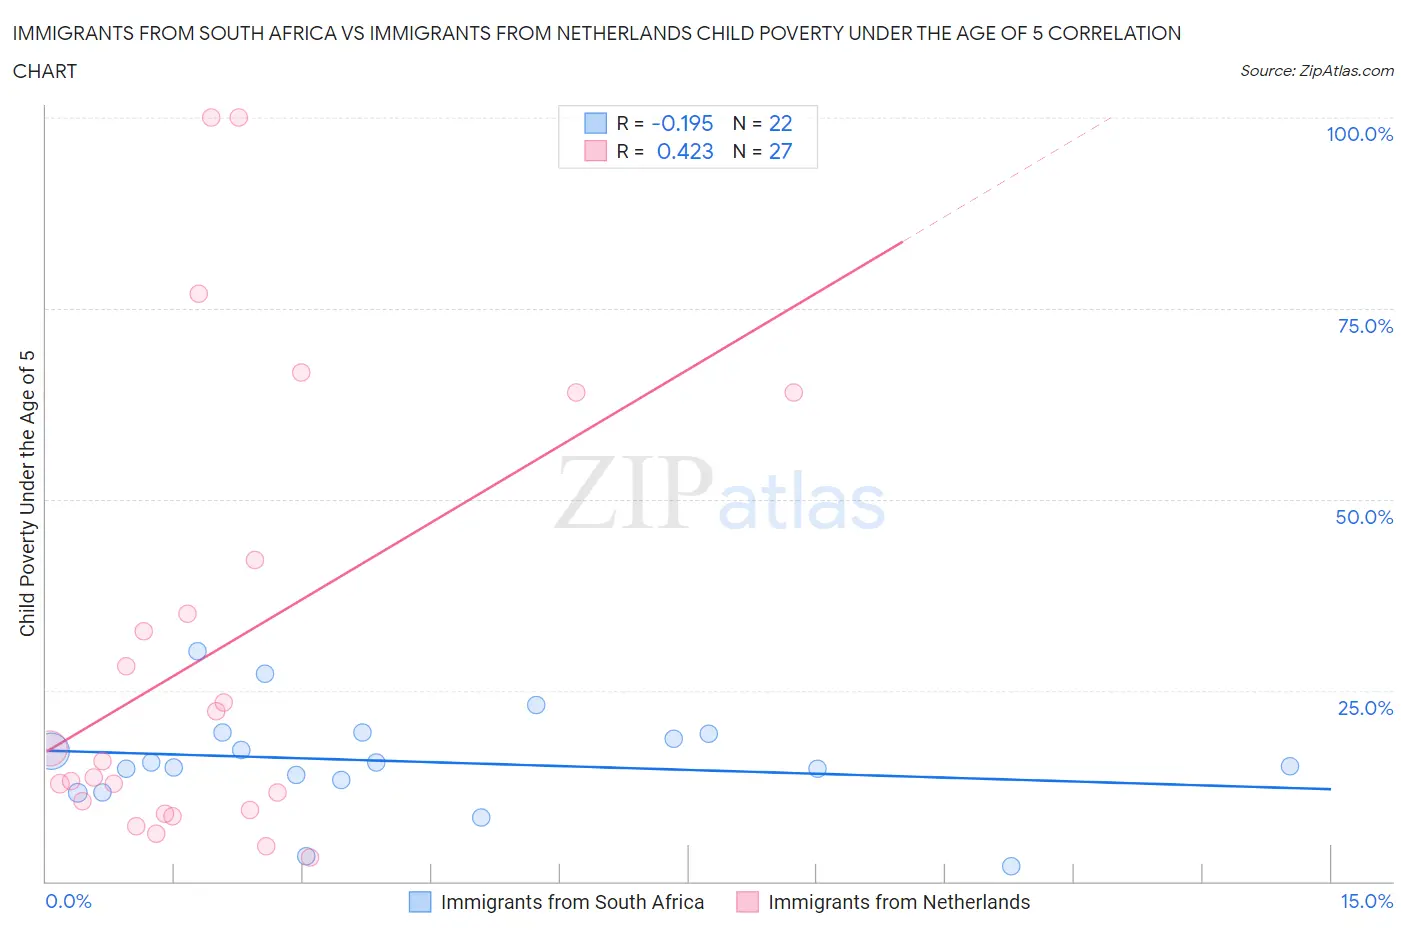
Immigrants from South Africa vs Immigrants from Netherlands Child Poverty Under the Age of 5 Correlation Chart
The statistical analysis conducted on geographies consisting of 224,707,543 people shows a poor negative correlation between the proportion of Immigrants from South Africa and poverty level among children under the age of 5 in the United States with a correlation coefficient (R) of -0.195 and weighted average of 15.8%. Similarly, the statistical analysis conducted on geographies consisting of 229,684,544 people shows a moderate positive correlation between the proportion of Immigrants from Netherlands and poverty level among children under the age of 5 in the United States with a correlation coefficient (R) of 0.423 and weighted average of 15.6%, a difference of 1.4%.
Child Poverty Under the Age of 5 Correlation Summary
| Measurement | Immigrants from South Africa | Immigrants from Netherlands |
| Minimum | 1.9% | 3.0% |
| Maximum | 30.2% | 100.0% |
| Range | 28.3% | 97.0% |
| Mean | 15.7% | 30.0% |
| Median | 15.2% | 15.7% |
| Interquartile 25% (IQ1) | 13.2% | 9.3% |
| Interquartile 75% (IQ3) | 19.3% | 42.1% |
| Interquartile Range (IQR) | 6.1% | 32.8% |
| Standard Deviation (Sample) | 6.5% | 29.1% |
| Standard Deviation (Population) | 6.4% | 28.5% |
Demographics Similar to Immigrants from South Africa and Immigrants from Netherlands by Child Poverty Under the Age of 5
In terms of child poverty under the age of 5, the demographic groups most similar to Immigrants from South Africa are Macedonian (15.8%, a difference of 0.070%), Immigrants from Kazakhstan (15.8%, a difference of 0.11%), Palestinian (15.8%, a difference of 0.11%), Immigrants from Canada (15.8%, a difference of 0.13%), and Immigrants from Zimbabwe (15.8%, a difference of 0.13%). Similarly, the demographic groups most similar to Immigrants from Netherlands are Chilean (15.6%, a difference of 0.020%), Immigrants from Latvia (15.6%, a difference of 0.16%), Immigrants from Malaysia (15.6%, a difference of 0.16%), Immigrants from Italy (15.6%, a difference of 0.18%), and Immigrants from Vietnam (15.6%, a difference of 0.24%).
| Demographics | Rating | Rank | Child Poverty Under the Age of 5 |
| Czechs | 97.8 /100 | #81 | Exceptional 15.5% |
| Immigrants | Italy | 97.7 /100 | #82 | Exceptional 15.6% |
| Chileans | 97.6 /100 | #83 | Exceptional 15.6% |
| Immigrants | Netherlands | 97.6 /100 | #84 | Exceptional 15.6% |
| Immigrants | Latvia | 97.4 /100 | #85 | Exceptional 15.6% |
| Immigrants | Malaysia | 97.4 /100 | #86 | Exceptional 15.6% |
| Immigrants | Vietnam | 97.4 /100 | #87 | Exceptional 15.6% |
| Jordanians | 97.3 /100 | #88 | Exceptional 15.6% |
| Immigrants | Croatia | 97.3 /100 | #89 | Exceptional 15.6% |
| Immigrants | France | 97.3 /100 | #90 | Exceptional 15.6% |
| Poles | 97.2 /100 | #91 | Exceptional 15.7% |
| Scandinavians | 97.1 /100 | #92 | Exceptional 15.7% |
| Ukrainians | 97.1 /100 | #93 | Exceptional 15.7% |
| Immigrants | South Eastern Asia | 97.1 /100 | #94 | Exceptional 15.7% |
| Immigrants | Switzerland | 96.4 /100 | #95 | Exceptional 15.8% |
| Immigrants | Kazakhstan | 96.2 /100 | #96 | Exceptional 15.8% |
| Macedonians | 96.2 /100 | #97 | Exceptional 15.8% |
| Immigrants | South Africa | 96.1 /100 | #98 | Exceptional 15.8% |
| Palestinians | 95.9 /100 | #99 | Exceptional 15.8% |
| Immigrants | Canada | 95.9 /100 | #100 | Exceptional 15.8% |
| Immigrants | Zimbabwe | 95.9 /100 | #101 | Exceptional 15.8% |