Immigrants from Syria vs Immigrants from Netherlands Child Poverty Under the Age of 5
COMPARE
Immigrants from Syria
Immigrants from Netherlands
Child Poverty Under the Age of 5
Child Poverty Under the Age of 5 Comparison
Immigrants from Syria
Immigrants from Netherlands
16.8%
CHILD POVERTY UNDER THE AGE OF 5
72.3/ 100
METRIC RATING
159th/ 347
METRIC RANK
15.6%
CHILD POVERTY UNDER THE AGE OF 5
97.6/ 100
METRIC RATING
84th/ 347
METRIC RANK
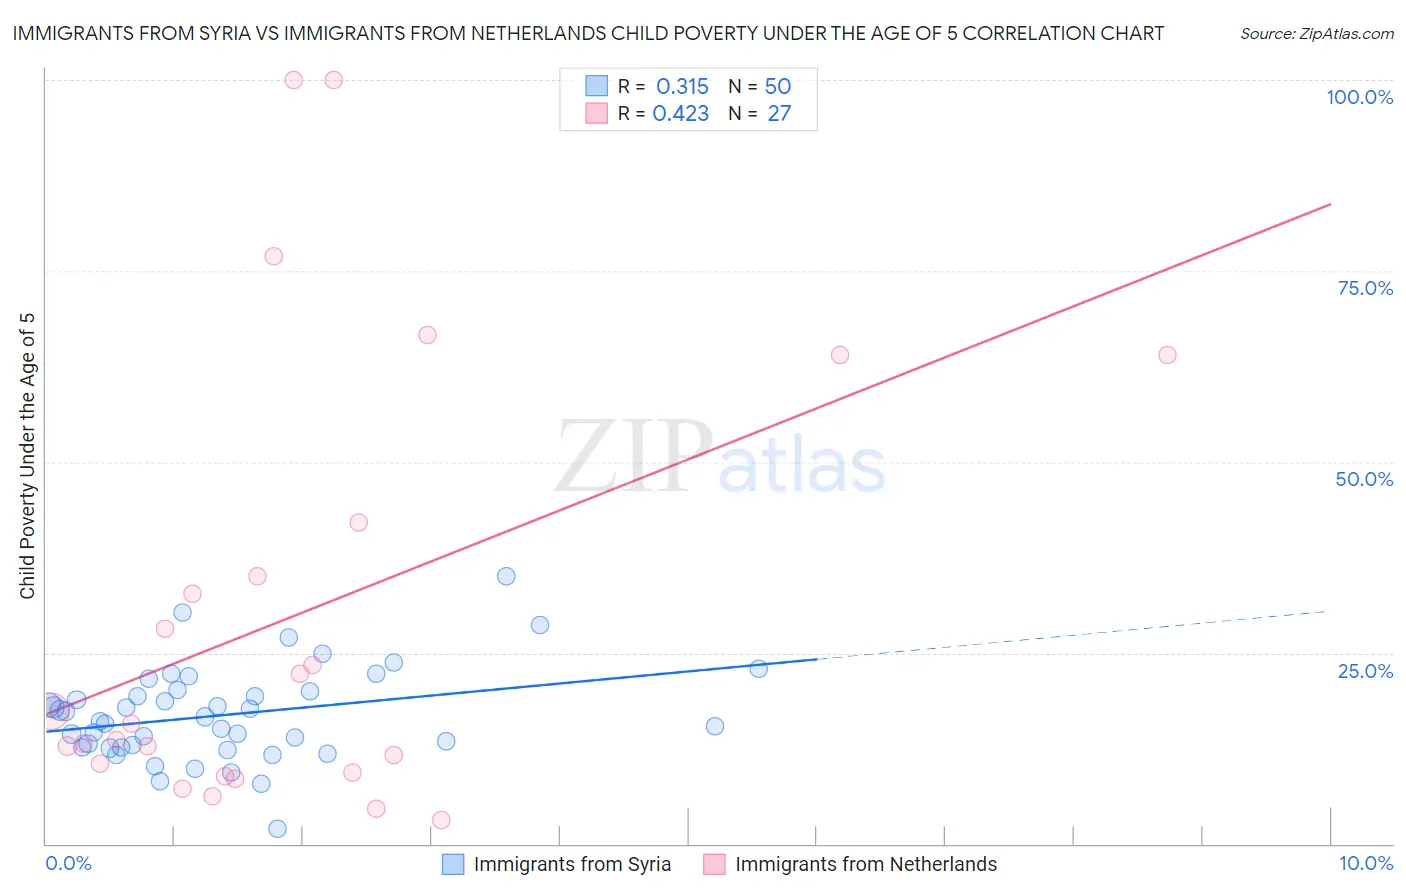
Immigrants from Syria vs Immigrants from Netherlands Child Poverty Under the Age of 5 Correlation Chart
The statistical analysis conducted on geographies consisting of 170,490,515 people shows a mild positive correlation between the proportion of Immigrants from Syria and poverty level among children under the age of 5 in the United States with a correlation coefficient (R) of 0.315 and weighted average of 16.8%. Similarly, the statistical analysis conducted on geographies consisting of 229,684,544 people shows a moderate positive correlation between the proportion of Immigrants from Netherlands and poverty level among children under the age of 5 in the United States with a correlation coefficient (R) of 0.423 and weighted average of 15.6%, a difference of 7.9%.
Child Poverty Under the Age of 5 Correlation Summary
| Measurement | Immigrants from Syria | Immigrants from Netherlands |
| Minimum | 2.0% | 3.0% |
| Maximum | 35.1% | 100.0% |
| Range | 33.0% | 97.0% |
| Mean | 16.9% | 30.0% |
| Median | 16.3% | 15.7% |
| Interquartile 25% (IQ1) | 12.7% | 9.3% |
| Interquartile 75% (IQ3) | 20.0% | 42.1% |
| Interquartile Range (IQR) | 7.3% | 32.8% |
| Standard Deviation (Sample) | 6.1% | 29.1% |
| Standard Deviation (Population) | 6.0% | 28.5% |
Similar Demographics by Child Poverty Under the Age of 5
Demographics Similar to Immigrants from Syria by Child Poverty Under the Age of 5
In terms of child poverty under the age of 5, the demographic groups most similar to Immigrants from Syria are Irish (16.8%, a difference of 0.030%), Czechoslovakian (16.8%, a difference of 0.040%), Venezuelan (16.8%, a difference of 0.20%), English (16.8%, a difference of 0.25%), and Afghan (16.8%, a difference of 0.29%).
| Demographics | Rating | Rank | Child Poverty Under the Age of 5 |
| Belgians | 77.2 /100 | #152 | Good 16.7% |
| Dutch | 77.1 /100 | #153 | Good 16.7% |
| Immigrants | Venezuela | 76.0 /100 | #154 | Good 16.7% |
| South Americans | 75.1 /100 | #155 | Good 16.7% |
| Afghans | 74.4 /100 | #156 | Good 16.8% |
| Venezuelans | 73.7 /100 | #157 | Good 16.8% |
| Czechoslovakians | 72.5 /100 | #158 | Good 16.8% |
| Immigrants | Syria | 72.3 /100 | #159 | Good 16.8% |
| Irish | 72.0 /100 | #160 | Good 16.8% |
| English | 70.4 /100 | #161 | Good 16.8% |
| Costa Ricans | 69.8 /100 | #162 | Good 16.9% |
| Scottish | 68.6 /100 | #163 | Good 16.9% |
| Immigrants | Oceania | 67.6 /100 | #164 | Good 16.9% |
| Immigrants | Colombia | 66.9 /100 | #165 | Good 16.9% |
| Slavs | 64.0 /100 | #166 | Good 17.0% |
Demographics Similar to Immigrants from Netherlands by Child Poverty Under the Age of 5
In terms of child poverty under the age of 5, the demographic groups most similar to Immigrants from Netherlands are Chilean (15.6%, a difference of 0.020%), Immigrants from Latvia (15.6%, a difference of 0.16%), Immigrants from Malaysia (15.6%, a difference of 0.16%), Immigrants from Italy (15.6%, a difference of 0.18%), and Immigrants from Vietnam (15.6%, a difference of 0.24%).
| Demographics | Rating | Rank | Child Poverty Under the Age of 5 |
| Immigrants | Turkey | 98.3 /100 | #77 | Exceptional 15.4% |
| Sri Lankans | 98.1 /100 | #78 | Exceptional 15.5% |
| Australians | 98.0 /100 | #79 | Exceptional 15.5% |
| Italians | 97.9 /100 | #80 | Exceptional 15.5% |
| Czechs | 97.8 /100 | #81 | Exceptional 15.5% |
| Immigrants | Italy | 97.7 /100 | #82 | Exceptional 15.6% |
| Chileans | 97.6 /100 | #83 | Exceptional 15.6% |
| Immigrants | Netherlands | 97.6 /100 | #84 | Exceptional 15.6% |
| Immigrants | Latvia | 97.4 /100 | #85 | Exceptional 15.6% |
| Immigrants | Malaysia | 97.4 /100 | #86 | Exceptional 15.6% |
| Immigrants | Vietnam | 97.4 /100 | #87 | Exceptional 15.6% |
| Jordanians | 97.3 /100 | #88 | Exceptional 15.6% |
| Immigrants | Croatia | 97.3 /100 | #89 | Exceptional 15.6% |
| Immigrants | France | 97.3 /100 | #90 | Exceptional 15.6% |
| Poles | 97.2 /100 | #91 | Exceptional 15.7% |