Estonian vs Nonimmigrants Child Poverty Under the Age of 5
COMPARE
Estonian
Nonimmigrants
Child Poverty Under the Age of 5
Child Poverty Under the Age of 5 Comparison
Estonians
Nonimmigrants
14.8%
CHILD POVERTY UNDER THE AGE OF 5
99.6/ 100
METRIC RATING
51st/ 347
METRIC RANK
19.7%
CHILD POVERTY UNDER THE AGE OF 5
0.4/ 100
METRIC RATING
250th/ 347
METRIC RANK
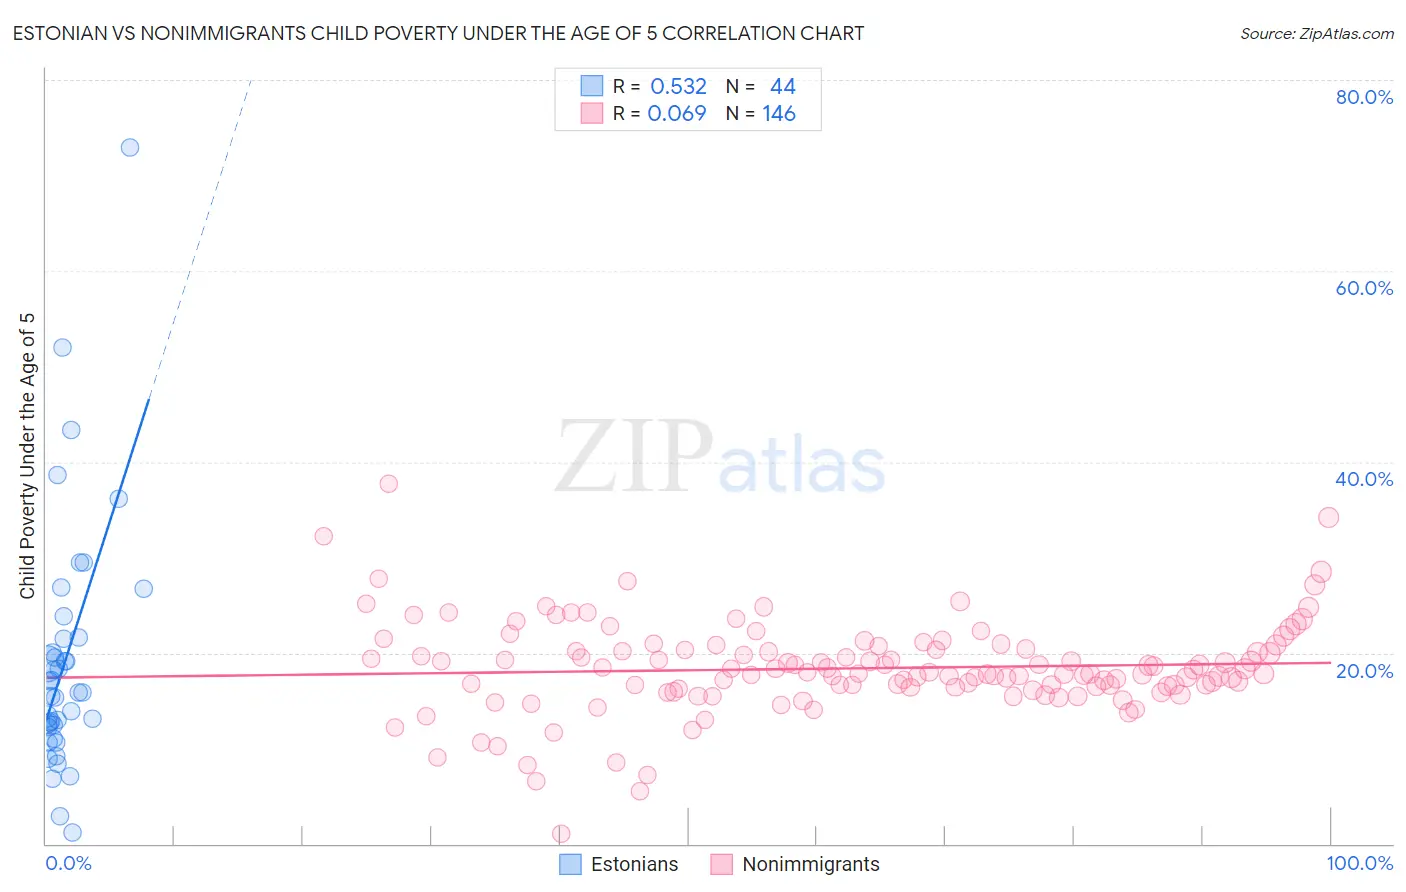
Estonian vs Nonimmigrants Child Poverty Under the Age of 5 Correlation Chart
The statistical analysis conducted on geographies consisting of 120,177,315 people shows a substantial positive correlation between the proportion of Estonians and poverty level among children under the age of 5 in the United States with a correlation coefficient (R) of 0.532 and weighted average of 14.8%. Similarly, the statistical analysis conducted on geographies consisting of 540,384,913 people shows a slight positive correlation between the proportion of Nonimmigrants and poverty level among children under the age of 5 in the United States with a correlation coefficient (R) of 0.069 and weighted average of 19.7%, a difference of 33.3%.
Child Poverty Under the Age of 5 Correlation Summary
| Measurement | Estonian | Nonimmigrants |
| Minimum | 1.2% | 1.0% |
| Maximum | 72.9% | 37.7% |
| Range | 71.7% | 36.6% |
| Mean | 19.2% | 18.4% |
| Median | 15.9% | 17.9% |
| Interquartile 25% (IQ1) | 12.3% | 16.4% |
| Interquartile 75% (IQ3) | 21.6% | 20.4% |
| Interquartile Range (IQR) | 9.2% | 4.0% |
| Standard Deviation (Sample) | 13.1% | 4.9% |
| Standard Deviation (Population) | 13.0% | 4.9% |
Similar Demographics by Child Poverty Under the Age of 5
Demographics Similar to Estonians by Child Poverty Under the Age of 5
In terms of child poverty under the age of 5, the demographic groups most similar to Estonians are Immigrants from Northern Europe (14.8%, a difference of 0.040%), Immigrants from Bulgaria (14.8%, a difference of 0.14%), Immigrants from Czechoslovakia (14.8%, a difference of 0.29%), Russian (14.8%, a difference of 0.39%), and Immigrants from Serbia (14.9%, a difference of 0.52%).
| Demographics | Rating | Rank | Child Poverty Under the Age of 5 |
| Immigrants | Philippines | 99.7 /100 | #44 | Exceptional 14.7% |
| Laotians | 99.6 /100 | #45 | Exceptional 14.7% |
| Tsimshian | 99.6 /100 | #46 | Exceptional 14.7% |
| Russians | 99.6 /100 | #47 | Exceptional 14.8% |
| Immigrants | Czechoslovakia | 99.6 /100 | #48 | Exceptional 14.8% |
| Immigrants | Bulgaria | 99.6 /100 | #49 | Exceptional 14.8% |
| Immigrants | Northern Europe | 99.6 /100 | #50 | Exceptional 14.8% |
| Estonians | 99.6 /100 | #51 | Exceptional 14.8% |
| Immigrants | Serbia | 99.5 /100 | #52 | Exceptional 14.9% |
| Luxembourgers | 99.4 /100 | #53 | Exceptional 14.9% |
| Immigrants | Israel | 99.4 /100 | #54 | Exceptional 14.9% |
| Danes | 99.4 /100 | #55 | Exceptional 14.9% |
| Immigrants | Pakistan | 99.4 /100 | #56 | Exceptional 14.9% |
| Egyptians | 99.4 /100 | #57 | Exceptional 14.9% |
| Swedes | 99.4 /100 | #58 | Exceptional 15.0% |
Demographics Similar to Nonimmigrants by Child Poverty Under the Age of 5
In terms of child poverty under the age of 5, the demographic groups most similar to Nonimmigrants are Immigrants from Middle Africa (19.7%, a difference of 0.050%), Marshallese (19.7%, a difference of 0.070%), Guyanese (19.7%, a difference of 0.080%), Pennsylvania German (19.8%, a difference of 0.17%), and Immigrants from Nicaragua (19.8%, a difference of 0.22%).
| Demographics | Rating | Rank | Child Poverty Under the Age of 5 |
| Osage | 0.5 /100 | #243 | Tragic 19.6% |
| Immigrants | Ghana | 0.5 /100 | #244 | Tragic 19.6% |
| Immigrants | Western Africa | 0.4 /100 | #245 | Tragic 19.7% |
| Cree | 0.4 /100 | #246 | Tragic 19.7% |
| Guyanese | 0.4 /100 | #247 | Tragic 19.7% |
| Marshallese | 0.4 /100 | #248 | Tragic 19.7% |
| Immigrants | Middle Africa | 0.4 /100 | #249 | Tragic 19.7% |
| Immigrants | Nonimmigrants | 0.4 /100 | #250 | Tragic 19.7% |
| Pennsylvania Germans | 0.3 /100 | #251 | Tragic 19.8% |
| Immigrants | Nicaragua | 0.3 /100 | #252 | Tragic 19.8% |
| Mexican American Indians | 0.3 /100 | #253 | Tragic 19.9% |
| Fijians | 0.3 /100 | #254 | Tragic 19.9% |
| Immigrants | Cuba | 0.2 /100 | #255 | Tragic 19.9% |
| Immigrants | Barbados | 0.2 /100 | #256 | Tragic 20.0% |
| Shoshone | 0.2 /100 | #257 | Tragic 20.0% |