Egyptian vs Immigrants from Cuba Child Poverty Among Boys Under 16
COMPARE
Egyptian
Immigrants from Cuba
Child Poverty Among Boys Under 16
Child Poverty Among Boys Under 16 Comparison
Egyptians
Immigrants from Cuba
14.7%
CHILD POVERTY AMONG BOYS UNDER 16
97.8/ 100
METRIC RATING
78th/ 347
METRIC RANK
18.8%
CHILD POVERTY AMONG BOYS UNDER 16
0.6/ 100
METRIC RATING
240th/ 347
METRIC RANK
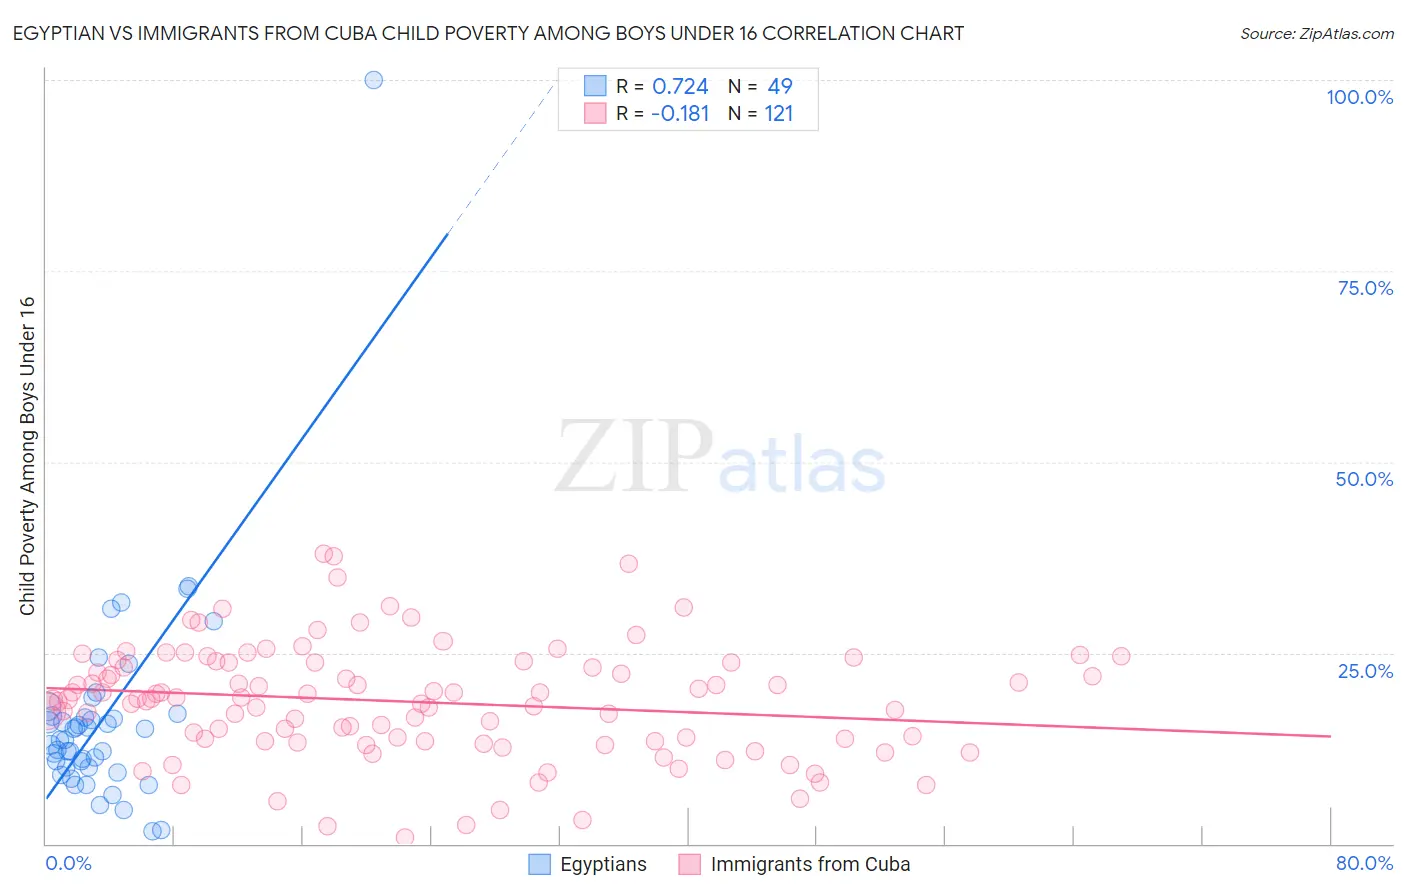
Egyptian vs Immigrants from Cuba Child Poverty Among Boys Under 16 Correlation Chart
The statistical analysis conducted on geographies consisting of 273,791,496 people shows a strong positive correlation between the proportion of Egyptians and poverty level among boys under the age of 16 in the United States with a correlation coefficient (R) of 0.724 and weighted average of 14.7%. Similarly, the statistical analysis conducted on geographies consisting of 321,856,633 people shows a poor negative correlation between the proportion of Immigrants from Cuba and poverty level among boys under the age of 16 in the United States with a correlation coefficient (R) of -0.181 and weighted average of 18.8%, a difference of 27.9%.
Child Poverty Among Boys Under 16 Correlation Summary
| Measurement | Egyptian | Immigrants from Cuba |
| Minimum | 1.6% | 0.84% |
| Maximum | 100.0% | 37.9% |
| Range | 98.4% | 37.1% |
| Mean | 16.4% | 18.6% |
| Median | 13.5% | 19.0% |
| Interquartile 25% (IQ1) | 10.0% | 13.4% |
| Interquartile 75% (IQ3) | 16.9% | 23.8% |
| Interquartile Range (IQR) | 6.9% | 10.4% |
| Standard Deviation (Sample) | 14.3% | 7.4% |
| Standard Deviation (Population) | 14.2% | 7.4% |
Similar Demographics by Child Poverty Among Boys Under 16
Demographics Similar to Egyptians by Child Poverty Among Boys Under 16
In terms of child poverty among boys under 16, the demographic groups most similar to Egyptians are Macedonian (14.7%, a difference of 0.050%), Immigrants from Croatia (14.7%, a difference of 0.11%), Immigrants from Eastern Europe (14.7%, a difference of 0.11%), Immigrants from Poland (14.7%, a difference of 0.16%), and Immigrants from Russia (14.7%, a difference of 0.20%).
| Demographics | Rating | Rank | Child Poverty Among Boys Under 16 |
| Immigrants | Netherlands | 98.1 /100 | #71 | Exceptional 14.6% |
| Immigrants | Latvia | 98.1 /100 | #72 | Exceptional 14.6% |
| Immigrants | Turkey | 98.0 /100 | #73 | Exceptional 14.6% |
| Australians | 98.0 /100 | #74 | Exceptional 14.7% |
| Immigrants | Poland | 97.9 /100 | #75 | Exceptional 14.7% |
| Immigrants | Croatia | 97.9 /100 | #76 | Exceptional 14.7% |
| Macedonians | 97.9 /100 | #77 | Exceptional 14.7% |
| Egyptians | 97.8 /100 | #78 | Exceptional 14.7% |
| Immigrants | Eastern Europe | 97.8 /100 | #79 | Exceptional 14.7% |
| Immigrants | Russia | 97.7 /100 | #80 | Exceptional 14.7% |
| Immigrants | Canada | 97.6 /100 | #81 | Exceptional 14.7% |
| Ukrainians | 97.6 /100 | #82 | Exceptional 14.7% |
| Immigrants | South Africa | 97.4 /100 | #83 | Exceptional 14.8% |
| Swiss | 97.3 /100 | #84 | Exceptional 14.8% |
| Taiwanese | 97.3 /100 | #85 | Exceptional 14.8% |
Demographics Similar to Immigrants from Cuba by Child Poverty Among Boys Under 16
In terms of child poverty among boys under 16, the demographic groups most similar to Immigrants from Cuba are Immigrants from Sudan (18.8%, a difference of 0.050%), Cape Verdean (18.7%, a difference of 0.34%), Ghanaian (18.9%, a difference of 0.56%), Immigrants from Laos (18.7%, a difference of 0.57%), and Immigrants from Eritrea (18.6%, a difference of 0.79%).
| Demographics | Rating | Rank | Child Poverty Among Boys Under 16 |
| Immigrants | Nigeria | 1.2 /100 | #233 | Tragic 18.4% |
| Nigerians | 1.1 /100 | #234 | Tragic 18.5% |
| Americans | 0.9 /100 | #235 | Tragic 18.6% |
| Sudanese | 0.9 /100 | #236 | Tragic 18.6% |
| Immigrants | Eritrea | 0.8 /100 | #237 | Tragic 18.6% |
| Immigrants | Laos | 0.8 /100 | #238 | Tragic 18.7% |
| Cape Verdeans | 0.7 /100 | #239 | Tragic 18.7% |
| Immigrants | Cuba | 0.6 /100 | #240 | Tragic 18.8% |
| Immigrants | Sudan | 0.6 /100 | #241 | Tragic 18.8% |
| Ghanaians | 0.5 /100 | #242 | Tragic 18.9% |
| Immigrants | Azores | 0.4 /100 | #243 | Tragic 18.9% |
| Immigrants | Middle Africa | 0.4 /100 | #244 | Tragic 18.9% |
| Cree | 0.4 /100 | #245 | Tragic 19.0% |
| Immigrants | Nicaragua | 0.4 /100 | #246 | Tragic 19.0% |
| Immigrants | Trinidad and Tobago | 0.3 /100 | #247 | Tragic 19.0% |