Immigrants from Lebanon vs Immigrants from Cuba Child Poverty Among Boys Under 16
COMPARE
Immigrants from Lebanon
Immigrants from Cuba
Child Poverty Among Boys Under 16
Child Poverty Among Boys Under 16 Comparison
Immigrants from Lebanon
Immigrants from Cuba
17.0%
CHILD POVERTY AMONG BOYS UNDER 16
21.2/ 100
METRIC RATING
194th/ 347
METRIC RANK
18.8%
CHILD POVERTY AMONG BOYS UNDER 16
0.6/ 100
METRIC RATING
240th/ 347
METRIC RANK
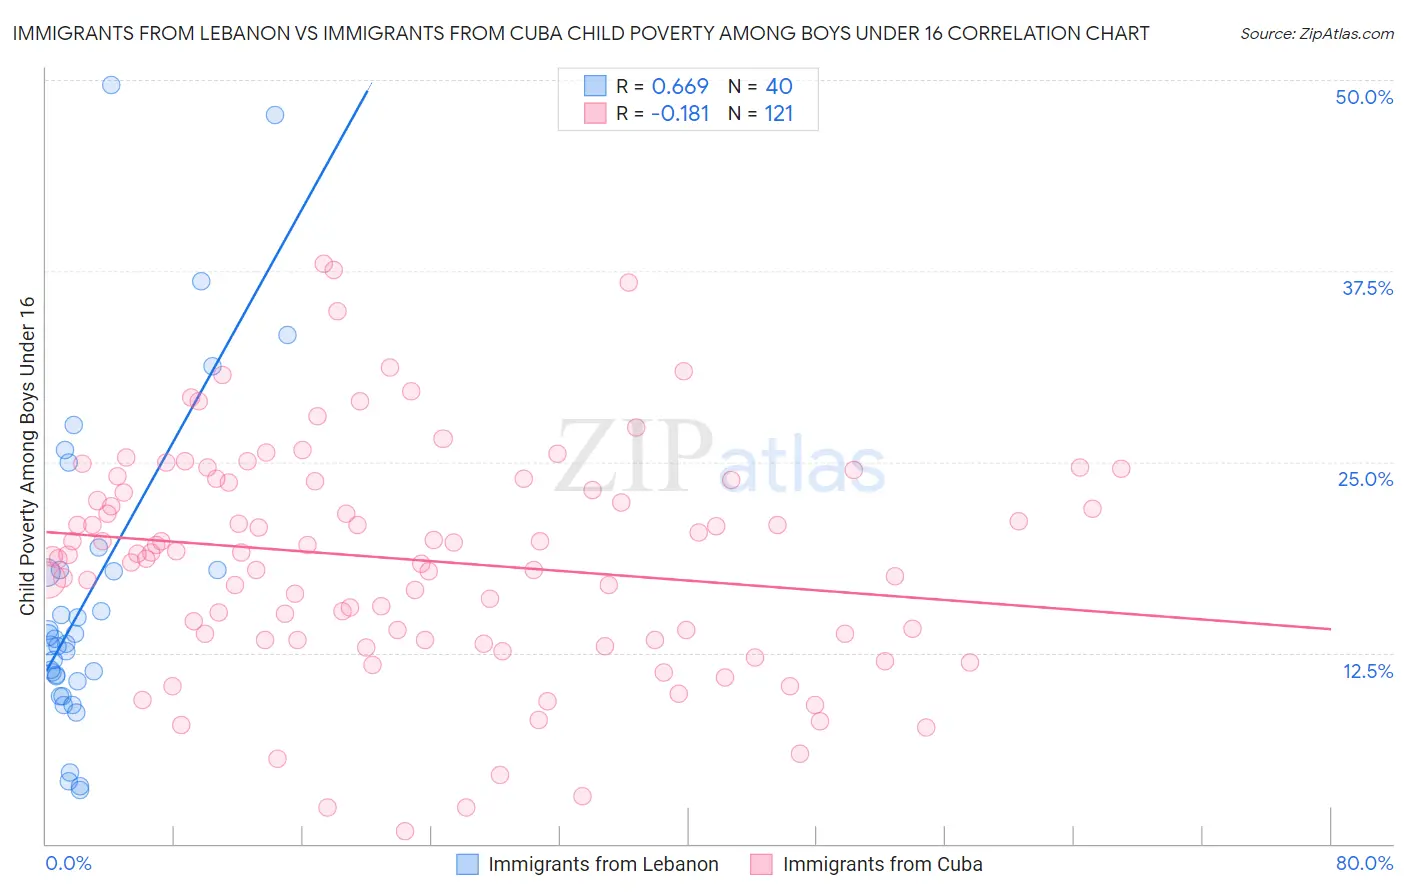
Immigrants from Lebanon vs Immigrants from Cuba Child Poverty Among Boys Under 16 Correlation Chart
The statistical analysis conducted on geographies consisting of 214,958,093 people shows a significant positive correlation between the proportion of Immigrants from Lebanon and poverty level among boys under the age of 16 in the United States with a correlation coefficient (R) of 0.669 and weighted average of 17.0%. Similarly, the statistical analysis conducted on geographies consisting of 321,856,633 people shows a poor negative correlation between the proportion of Immigrants from Cuba and poverty level among boys under the age of 16 in the United States with a correlation coefficient (R) of -0.181 and weighted average of 18.8%, a difference of 10.2%.
Child Poverty Among Boys Under 16 Correlation Summary
| Measurement | Immigrants from Lebanon | Immigrants from Cuba |
| Minimum | 3.5% | 0.84% |
| Maximum | 49.7% | 37.9% |
| Range | 46.2% | 37.1% |
| Mean | 16.5% | 18.6% |
| Median | 13.2% | 19.0% |
| Interquartile 25% (IQ1) | 10.8% | 13.4% |
| Interquartile 75% (IQ3) | 17.9% | 23.8% |
| Interquartile Range (IQR) | 7.2% | 10.4% |
| Standard Deviation (Sample) | 10.7% | 7.4% |
| Standard Deviation (Population) | 10.6% | 7.4% |
Similar Demographics by Child Poverty Among Boys Under 16
Demographics Similar to Immigrants from Lebanon by Child Poverty Among Boys Under 16
In terms of child poverty among boys under 16, the demographic groups most similar to Immigrants from Lebanon are Immigrants from Uganda (17.0%, a difference of 0.060%), Immigrants from Iraq (17.0%, a difference of 0.060%), Spanish (17.0%, a difference of 0.070%), Spaniard (17.1%, a difference of 0.12%), and Immigrants from Kenya (17.1%, a difference of 0.18%).
| Demographics | Rating | Rank | Child Poverty Among Boys Under 16 |
| Immigrants | Costa Rica | 37.8 /100 | #187 | Fair 16.7% |
| Immigrants | South America | 37.7 /100 | #188 | Fair 16.7% |
| Immigrants | Morocco | 34.5 /100 | #189 | Fair 16.7% |
| Arabs | 31.1 /100 | #190 | Fair 16.8% |
| Alaska Natives | 29.8 /100 | #191 | Fair 16.8% |
| Immigrants | Uganda | 21.6 /100 | #192 | Fair 17.0% |
| Immigrants | Iraq | 21.6 /100 | #193 | Fair 17.0% |
| Immigrants | Lebanon | 21.2 /100 | #194 | Fair 17.0% |
| Spanish | 20.8 /100 | #195 | Fair 17.0% |
| Spaniards | 20.5 /100 | #196 | Fair 17.1% |
| Immigrants | Kenya | 20.1 /100 | #197 | Fair 17.1% |
| Immigrants | Cameroon | 19.0 /100 | #198 | Poor 17.1% |
| Delaware | 18.8 /100 | #199 | Poor 17.1% |
| Immigrants | Uruguay | 16.9 /100 | #200 | Poor 17.2% |
| Immigrants | Afghanistan | 13.7 /100 | #201 | Poor 17.3% |
Demographics Similar to Immigrants from Cuba by Child Poverty Among Boys Under 16
In terms of child poverty among boys under 16, the demographic groups most similar to Immigrants from Cuba are Immigrants from Sudan (18.8%, a difference of 0.050%), Cape Verdean (18.7%, a difference of 0.34%), Ghanaian (18.9%, a difference of 0.56%), Immigrants from Laos (18.7%, a difference of 0.57%), and Immigrants from Eritrea (18.6%, a difference of 0.79%).
| Demographics | Rating | Rank | Child Poverty Among Boys Under 16 |
| Immigrants | Nigeria | 1.2 /100 | #233 | Tragic 18.4% |
| Nigerians | 1.1 /100 | #234 | Tragic 18.5% |
| Americans | 0.9 /100 | #235 | Tragic 18.6% |
| Sudanese | 0.9 /100 | #236 | Tragic 18.6% |
| Immigrants | Eritrea | 0.8 /100 | #237 | Tragic 18.6% |
| Immigrants | Laos | 0.8 /100 | #238 | Tragic 18.7% |
| Cape Verdeans | 0.7 /100 | #239 | Tragic 18.7% |
| Immigrants | Cuba | 0.6 /100 | #240 | Tragic 18.8% |
| Immigrants | Sudan | 0.6 /100 | #241 | Tragic 18.8% |
| Ghanaians | 0.5 /100 | #242 | Tragic 18.9% |
| Immigrants | Azores | 0.4 /100 | #243 | Tragic 18.9% |
| Immigrants | Middle Africa | 0.4 /100 | #244 | Tragic 18.9% |
| Cree | 0.4 /100 | #245 | Tragic 19.0% |
| Immigrants | Nicaragua | 0.4 /100 | #246 | Tragic 19.0% |
| Immigrants | Trinidad and Tobago | 0.3 /100 | #247 | Tragic 19.0% |