Egyptian vs Immigrants from Cuba 8th Grade
COMPARE
Egyptian
Immigrants from Cuba
8th Grade
8th Grade Comparison
Egyptians
Immigrants from Cuba
95.8%
8TH GRADE
58.2/ 100
METRIC RATING
171st/ 347
METRIC RANK
93.2%
8TH GRADE
0.0/ 100
METRIC RATING
319th/ 347
METRIC RANK
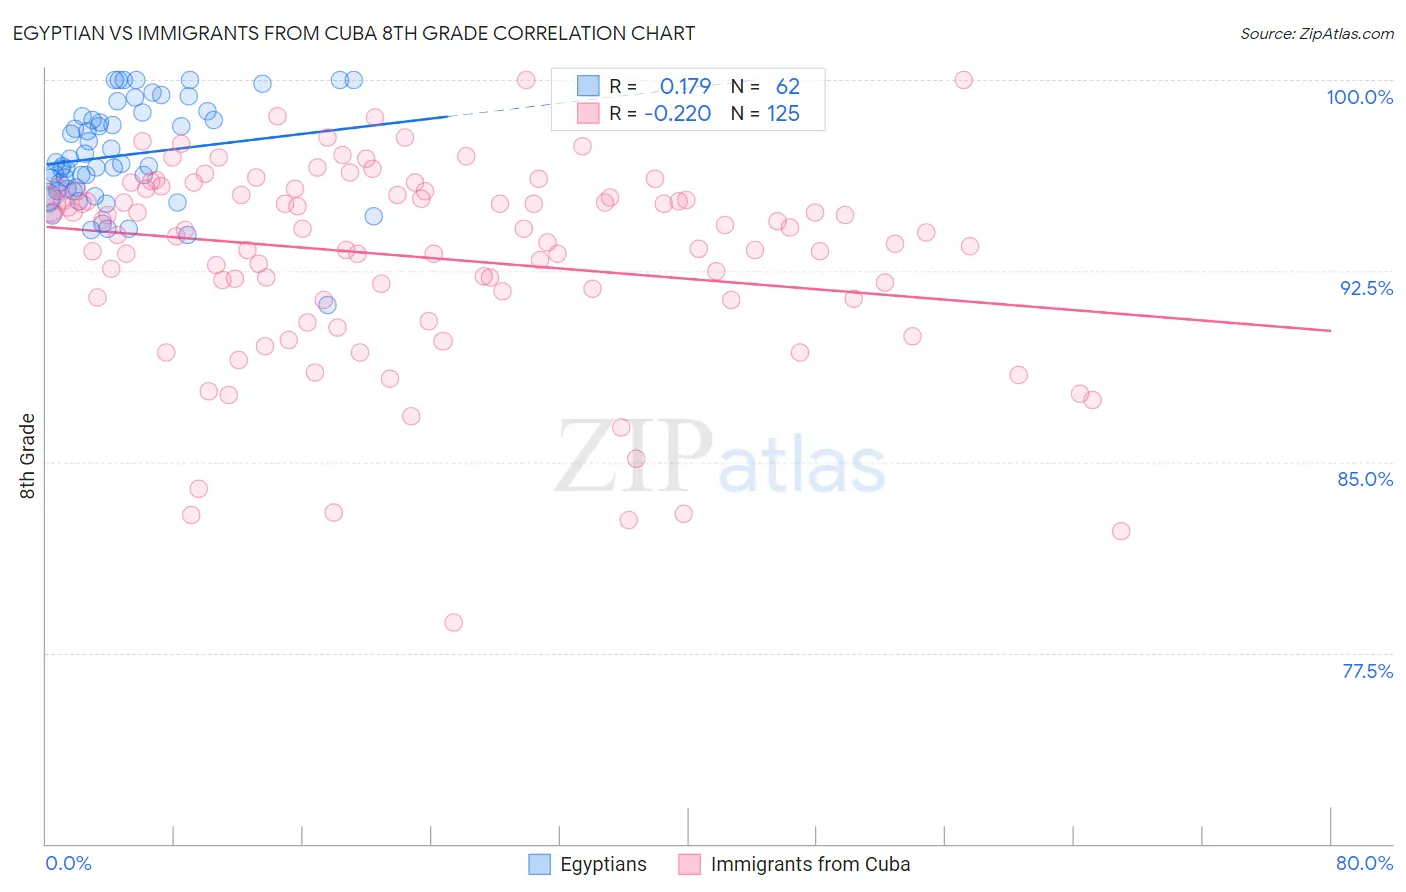
Egyptian vs Immigrants from Cuba 8th Grade Correlation Chart
The statistical analysis conducted on geographies consisting of 276,927,423 people shows a poor positive correlation between the proportion of Egyptians and percentage of population with at least 8th grade education in the United States with a correlation coefficient (R) of 0.179 and weighted average of 95.8%. Similarly, the statistical analysis conducted on geographies consisting of 326,028,159 people shows a weak negative correlation between the proportion of Immigrants from Cuba and percentage of population with at least 8th grade education in the United States with a correlation coefficient (R) of -0.220 and weighted average of 93.2%, a difference of 2.8%.
8th Grade Correlation Summary
| Measurement | Egyptian | Immigrants from Cuba |
| Minimum | 91.1% | 78.7% |
| Maximum | 100.0% | 100.0% |
| Range | 8.9% | 21.3% |
| Mean | 97.0% | 93.0% |
| Median | 96.7% | 94.1% |
| Interquartile 25% (IQ1) | 95.7% | 91.4% |
| Interquartile 75% (IQ3) | 98.6% | 95.6% |
| Interquartile Range (IQR) | 2.9% | 4.2% |
| Standard Deviation (Sample) | 2.0% | 3.9% |
| Standard Deviation (Population) | 2.0% | 3.9% |
Similar Demographics by 8th Grade
Demographics Similar to Egyptians by 8th Grade
In terms of 8th grade, the demographic groups most similar to Egyptians are Immigrants from Iran (95.8%, a difference of 0.0%), Ute (95.8%, a difference of 0.0%), Immigrants from Korea (95.8%, a difference of 0.0%), Spaniard (95.8%, a difference of 0.010%), and Immigrants from Ukraine (95.8%, a difference of 0.010%).
| Demographics | Rating | Rank | 8th Grade |
| Immigrants | Italy | 63.5 /100 | #164 | Good 95.8% |
| Alsatians | 61.4 /100 | #165 | Good 95.8% |
| Immigrants | Poland | 61.1 /100 | #166 | Good 95.8% |
| Spaniards | 60.0 /100 | #167 | Good 95.8% |
| Immigrants | Ukraine | 59.5 /100 | #168 | Average 95.8% |
| Immigrants | Iran | 58.6 /100 | #169 | Average 95.8% |
| Ute | 58.5 /100 | #170 | Average 95.8% |
| Egyptians | 58.2 /100 | #171 | Average 95.8% |
| Immigrants | Korea | 57.9 /100 | #172 | Average 95.8% |
| Mongolians | 53.0 /100 | #173 | Average 95.8% |
| Chileans | 50.0 /100 | #174 | Average 95.7% |
| Immigrants | Albania | 49.6 /100 | #175 | Average 95.7% |
| Pakistanis | 48.8 /100 | #176 | Average 95.7% |
| Marshallese | 47.6 /100 | #177 | Average 95.7% |
| Venezuelans | 47.5 /100 | #178 | Average 95.7% |
Demographics Similar to Immigrants from Cuba by 8th Grade
In terms of 8th grade, the demographic groups most similar to Immigrants from Cuba are Puerto Rican (93.2%, a difference of 0.030%), Immigrants from Fiji (93.2%, a difference of 0.030%), Immigrants from Ecuador (93.3%, a difference of 0.040%), Immigrants from Cambodia (93.3%, a difference of 0.10%), and Belizean (93.1%, a difference of 0.16%).
| Demographics | Rating | Rank | 8th Grade |
| Cape Verdeans | 0.0 /100 | #312 | Tragic 93.5% |
| Immigrants | Caribbean | 0.0 /100 | #313 | Tragic 93.5% |
| Immigrants | Vietnam | 0.0 /100 | #314 | Tragic 93.5% |
| Vietnamese | 0.0 /100 | #315 | Tragic 93.5% |
| Immigrants | Cambodia | 0.0 /100 | #316 | Tragic 93.3% |
| Immigrants | Ecuador | 0.0 /100 | #317 | Tragic 93.3% |
| Puerto Ricans | 0.0 /100 | #318 | Tragic 93.2% |
| Immigrants | Cuba | 0.0 /100 | #319 | Tragic 93.2% |
| Immigrants | Fiji | 0.0 /100 | #320 | Tragic 93.2% |
| Belizeans | 0.0 /100 | #321 | Tragic 93.1% |
| Nicaraguans | 0.0 /100 | #322 | Tragic 93.0% |
| Immigrants | Belize | 0.0 /100 | #323 | Tragic 92.9% |
| Nepalese | 0.0 /100 | #324 | Tragic 92.8% |
| Dominicans | 0.0 /100 | #325 | Tragic 92.8% |
| Central American Indians | 0.0 /100 | #326 | Tragic 92.7% |