Puget Sound Salish vs Immigrants from Cuba Child Poverty Among Boys Under 16
COMPARE
Puget Sound Salish
Immigrants from Cuba
Child Poverty Among Boys Under 16
Child Poverty Among Boys Under 16 Comparison
Puget Sound Salish
Immigrants from Cuba
15.8%
CHILD POVERTY AMONG BOYS UNDER 16
79.8/ 100
METRIC RATING
151st/ 347
METRIC RANK
18.8%
CHILD POVERTY AMONG BOYS UNDER 16
0.6/ 100
METRIC RATING
240th/ 347
METRIC RANK
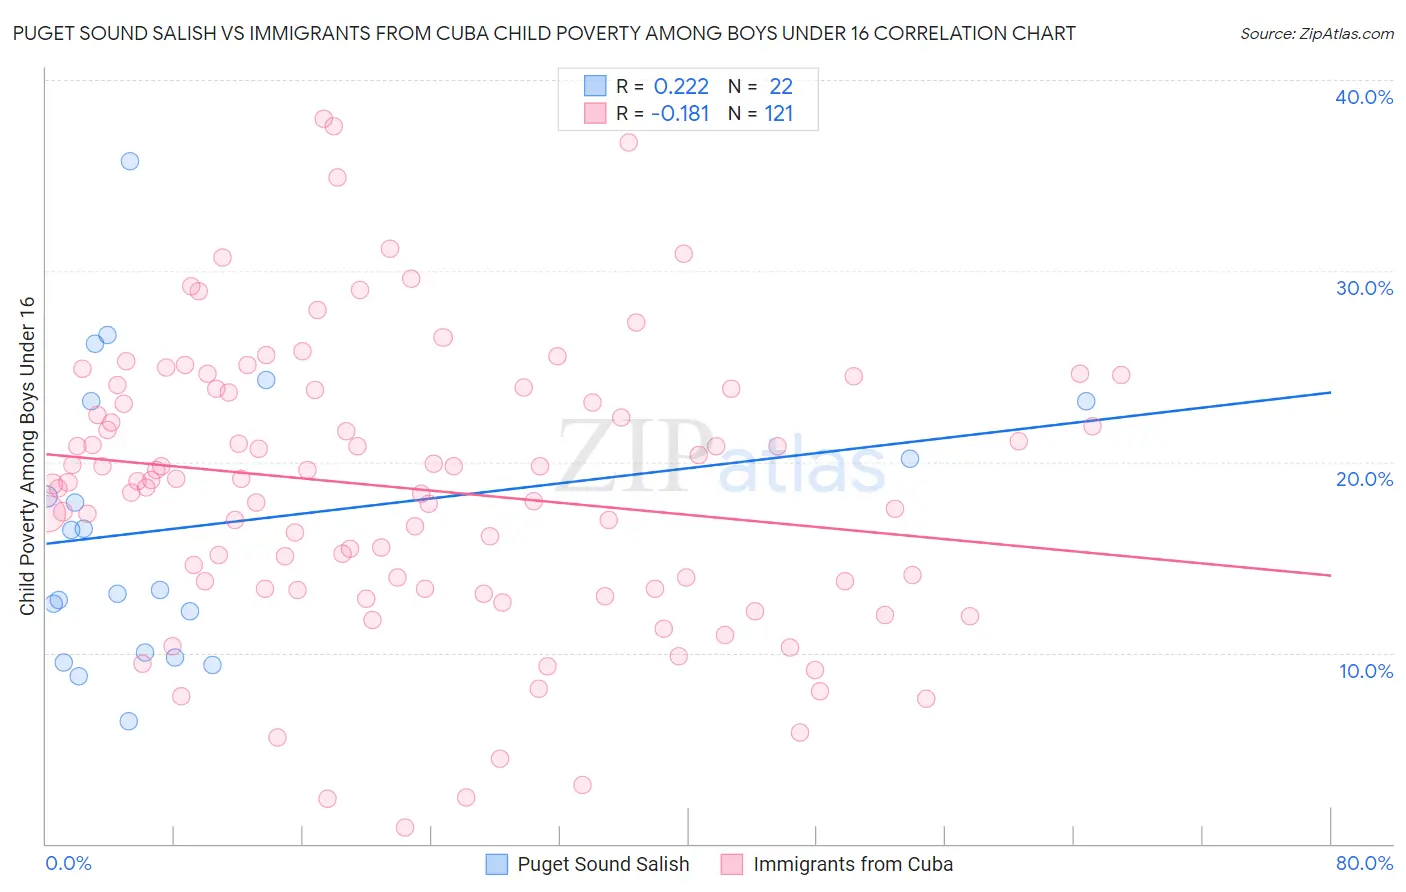
Puget Sound Salish vs Immigrants from Cuba Child Poverty Among Boys Under 16 Correlation Chart
The statistical analysis conducted on geographies consisting of 45,876,308 people shows a weak positive correlation between the proportion of Puget Sound Salish and poverty level among boys under the age of 16 in the United States with a correlation coefficient (R) of 0.222 and weighted average of 15.8%. Similarly, the statistical analysis conducted on geographies consisting of 321,856,633 people shows a poor negative correlation between the proportion of Immigrants from Cuba and poverty level among boys under the age of 16 in the United States with a correlation coefficient (R) of -0.181 and weighted average of 18.8%, a difference of 18.8%.
Child Poverty Among Boys Under 16 Correlation Summary
| Measurement | Puget Sound Salish | Immigrants from Cuba |
| Minimum | 6.4% | 0.84% |
| Maximum | 35.8% | 37.9% |
| Range | 29.3% | 37.1% |
| Mean | 16.6% | 18.6% |
| Median | 14.8% | 19.0% |
| Interquartile 25% (IQ1) | 10.0% | 13.4% |
| Interquartile 75% (IQ3) | 23.2% | 23.8% |
| Interquartile Range (IQR) | 13.2% | 10.4% |
| Standard Deviation (Sample) | 7.4% | 7.4% |
| Standard Deviation (Population) | 7.2% | 7.4% |
Similar Demographics by Child Poverty Among Boys Under 16
Demographics Similar to Puget Sound Salish by Child Poverty Among Boys Under 16
In terms of child poverty among boys under 16, the demographic groups most similar to Puget Sound Salish are Immigrants from Venezuela (15.8%, a difference of 0.050%), Immigrants from Jordan (15.8%, a difference of 0.080%), Slovak (15.8%, a difference of 0.090%), French (15.8%, a difference of 0.19%), and Brazilian (15.8%, a difference of 0.23%).
| Demographics | Rating | Rank | Child Poverty Among Boys Under 16 |
| Immigrants | Peru | 83.5 /100 | #144 | Excellent 15.7% |
| Samoans | 83.2 /100 | #145 | Excellent 15.7% |
| New Zealanders | 82.4 /100 | #146 | Excellent 15.7% |
| Venezuelans | 82.1 /100 | #147 | Excellent 15.7% |
| Brazilians | 81.0 /100 | #148 | Excellent 15.8% |
| Slovaks | 80.3 /100 | #149 | Excellent 15.8% |
| Immigrants | Jordan | 80.2 /100 | #150 | Excellent 15.8% |
| Puget Sound Salish | 79.8 /100 | #151 | Good 15.8% |
| Immigrants | Venezuela | 79.5 /100 | #152 | Good 15.8% |
| French | 78.7 /100 | #153 | Good 15.8% |
| Syrians | 77.5 /100 | #154 | Good 15.9% |
| French Canadians | 76.6 /100 | #155 | Good 15.9% |
| Israelis | 76.5 /100 | #156 | Good 15.9% |
| Immigrants | Nepal | 76.0 /100 | #157 | Good 15.9% |
| Yugoslavians | 75.9 /100 | #158 | Good 15.9% |
Demographics Similar to Immigrants from Cuba by Child Poverty Among Boys Under 16
In terms of child poverty among boys under 16, the demographic groups most similar to Immigrants from Cuba are Immigrants from Sudan (18.8%, a difference of 0.050%), Cape Verdean (18.7%, a difference of 0.34%), Ghanaian (18.9%, a difference of 0.56%), Immigrants from Laos (18.7%, a difference of 0.57%), and Immigrants from Eritrea (18.6%, a difference of 0.79%).
| Demographics | Rating | Rank | Child Poverty Among Boys Under 16 |
| Immigrants | Nigeria | 1.2 /100 | #233 | Tragic 18.4% |
| Nigerians | 1.1 /100 | #234 | Tragic 18.5% |
| Americans | 0.9 /100 | #235 | Tragic 18.6% |
| Sudanese | 0.9 /100 | #236 | Tragic 18.6% |
| Immigrants | Eritrea | 0.8 /100 | #237 | Tragic 18.6% |
| Immigrants | Laos | 0.8 /100 | #238 | Tragic 18.7% |
| Cape Verdeans | 0.7 /100 | #239 | Tragic 18.7% |
| Immigrants | Cuba | 0.6 /100 | #240 | Tragic 18.8% |
| Immigrants | Sudan | 0.6 /100 | #241 | Tragic 18.8% |
| Ghanaians | 0.5 /100 | #242 | Tragic 18.9% |
| Immigrants | Azores | 0.4 /100 | #243 | Tragic 18.9% |
| Immigrants | Middle Africa | 0.4 /100 | #244 | Tragic 18.9% |
| Cree | 0.4 /100 | #245 | Tragic 19.0% |
| Immigrants | Nicaragua | 0.4 /100 | #246 | Tragic 19.0% |
| Immigrants | Trinidad and Tobago | 0.3 /100 | #247 | Tragic 19.0% |