Egyptian vs Lumbee Child Poverty Among Boys Under 16
COMPARE
Egyptian
Lumbee
Child Poverty Among Boys Under 16
Child Poverty Among Boys Under 16 Comparison
Egyptians
Lumbee
14.7%
CHILD POVERTY AMONG BOYS UNDER 16
97.8/ 100
METRIC RATING
78th/ 347
METRIC RANK
31.9%
CHILD POVERTY AMONG BOYS UNDER 16
0.0/ 100
METRIC RATING
346th/ 347
METRIC RANK
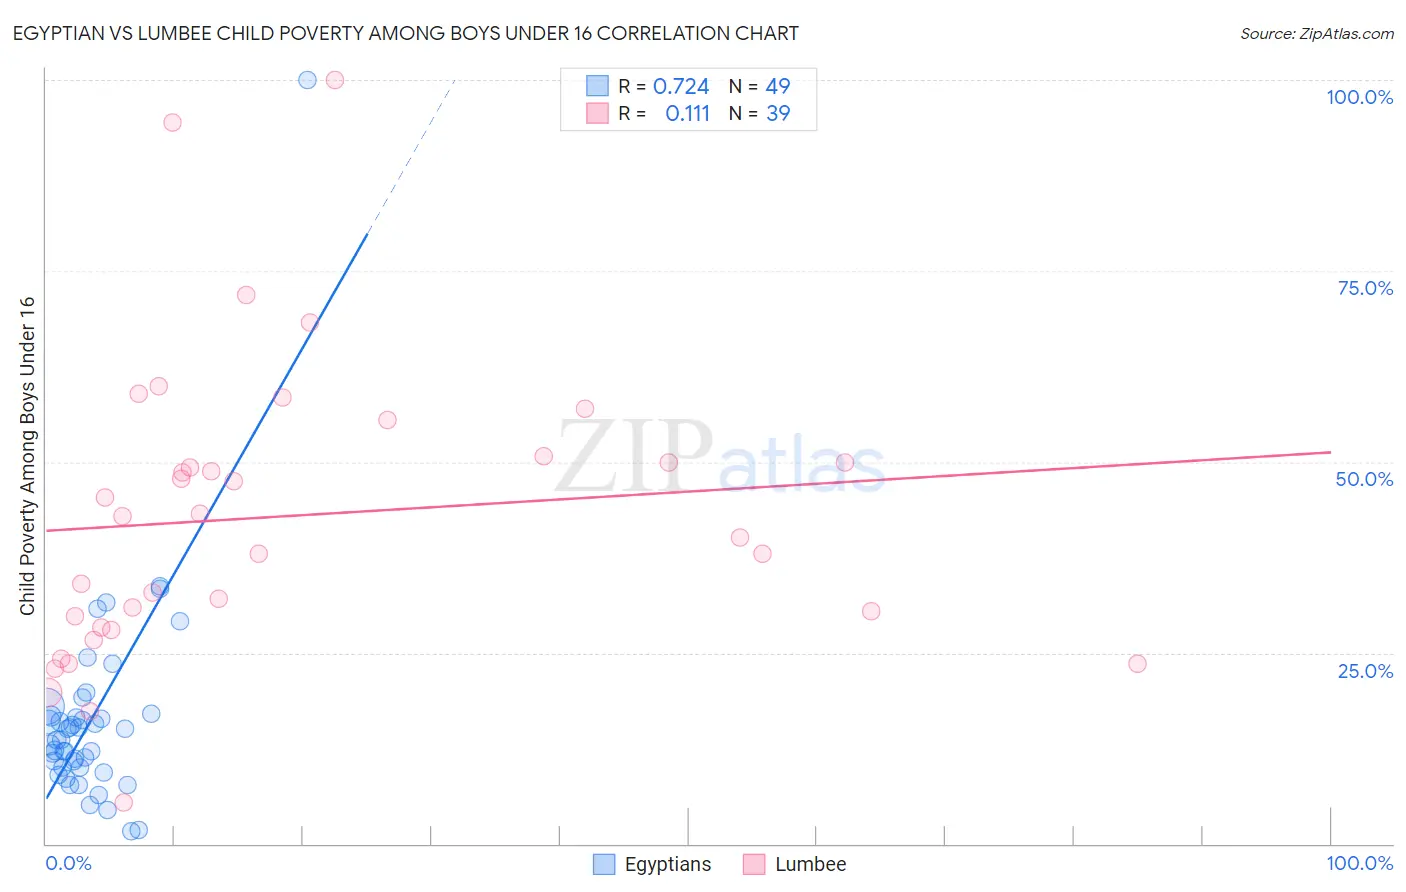
Egyptian vs Lumbee Child Poverty Among Boys Under 16 Correlation Chart
The statistical analysis conducted on geographies consisting of 273,791,496 people shows a strong positive correlation between the proportion of Egyptians and poverty level among boys under the age of 16 in the United States with a correlation coefficient (R) of 0.724 and weighted average of 14.7%. Similarly, the statistical analysis conducted on geographies consisting of 91,775,991 people shows a poor positive correlation between the proportion of Lumbee and poverty level among boys under the age of 16 in the United States with a correlation coefficient (R) of 0.111 and weighted average of 31.9%, a difference of 117.3%.
Child Poverty Among Boys Under 16 Correlation Summary
| Measurement | Egyptian | Lumbee |
| Minimum | 1.6% | 5.4% |
| Maximum | 100.0% | 100.0% |
| Range | 98.4% | 94.6% |
| Mean | 16.4% | 42.9% |
| Median | 13.5% | 42.9% |
| Interquartile 25% (IQ1) | 10.0% | 28.2% |
| Interquartile 75% (IQ3) | 16.9% | 50.7% |
| Interquartile Range (IQR) | 6.9% | 22.4% |
| Standard Deviation (Sample) | 14.3% | 19.5% |
| Standard Deviation (Population) | 14.2% | 19.3% |
Similar Demographics by Child Poverty Among Boys Under 16
Demographics Similar to Egyptians by Child Poverty Among Boys Under 16
In terms of child poverty among boys under 16, the demographic groups most similar to Egyptians are Macedonian (14.7%, a difference of 0.050%), Immigrants from Croatia (14.7%, a difference of 0.11%), Immigrants from Eastern Europe (14.7%, a difference of 0.11%), Immigrants from Poland (14.7%, a difference of 0.16%), and Immigrants from Russia (14.7%, a difference of 0.20%).
| Demographics | Rating | Rank | Child Poverty Among Boys Under 16 |
| Immigrants | Netherlands | 98.1 /100 | #71 | Exceptional 14.6% |
| Immigrants | Latvia | 98.1 /100 | #72 | Exceptional 14.6% |
| Immigrants | Turkey | 98.0 /100 | #73 | Exceptional 14.6% |
| Australians | 98.0 /100 | #74 | Exceptional 14.7% |
| Immigrants | Poland | 97.9 /100 | #75 | Exceptional 14.7% |
| Immigrants | Croatia | 97.9 /100 | #76 | Exceptional 14.7% |
| Macedonians | 97.9 /100 | #77 | Exceptional 14.7% |
| Egyptians | 97.8 /100 | #78 | Exceptional 14.7% |
| Immigrants | Eastern Europe | 97.8 /100 | #79 | Exceptional 14.7% |
| Immigrants | Russia | 97.7 /100 | #80 | Exceptional 14.7% |
| Immigrants | Canada | 97.6 /100 | #81 | Exceptional 14.7% |
| Ukrainians | 97.6 /100 | #82 | Exceptional 14.7% |
| Immigrants | South Africa | 97.4 /100 | #83 | Exceptional 14.8% |
| Swiss | 97.3 /100 | #84 | Exceptional 14.8% |
| Taiwanese | 97.3 /100 | #85 | Exceptional 14.8% |
Demographics Similar to Lumbee by Child Poverty Among Boys Under 16
In terms of child poverty among boys under 16, the demographic groups most similar to Lumbee are Tohono O'odham (31.6%, a difference of 1.1%), Puerto Rican (32.8%, a difference of 2.9%), Yuman (30.6%, a difference of 4.2%), Navajo (30.3%, a difference of 5.4%), and Pima (29.7%, a difference of 7.3%).
| Demographics | Rating | Rank | Child Poverty Among Boys Under 16 |
| Apache | 0.0 /100 | #333 | Tragic 24.5% |
| Blacks/African Americans | 0.0 /100 | #334 | Tragic 24.5% |
| Yup'ik | 0.0 /100 | #335 | Tragic 24.7% |
| Sioux | 0.0 /100 | #336 | Tragic 25.3% |
| Cheyenne | 0.0 /100 | #337 | Tragic 25.8% |
| Hopi | 0.0 /100 | #338 | Tragic 25.9% |
| Houma | 0.0 /100 | #339 | Tragic 26.2% |
| Crow | 0.0 /100 | #340 | Tragic 26.3% |
| Immigrants | Yemen | 0.0 /100 | #341 | Tragic 28.9% |
| Pima | 0.0 /100 | #342 | Tragic 29.7% |
| Navajo | 0.0 /100 | #343 | Tragic 30.3% |
| Yuman | 0.0 /100 | #344 | Tragic 30.6% |
| Tohono O'odham | 0.0 /100 | #345 | Tragic 31.6% |
| Lumbee | 0.0 /100 | #346 | Tragic 31.9% |
| Puerto Ricans | 0.0 /100 | #347 | Tragic 32.8% |