Liberian vs Alaska Native Child Poverty Under the Age of 5
COMPARE
Liberian
Alaska Native
Child Poverty Under the Age of 5
Child Poverty Under the Age of 5 Comparison
Liberians
Alaska Natives
20.2%
CHILD POVERTY UNDER THE AGE OF 5
0.1/ 100
METRIC RATING
262nd/ 347
METRIC RANK
19.6%
CHILD POVERTY UNDER THE AGE OF 5
0.5/ 100
METRIC RATING
241st/ 347
METRIC RANK
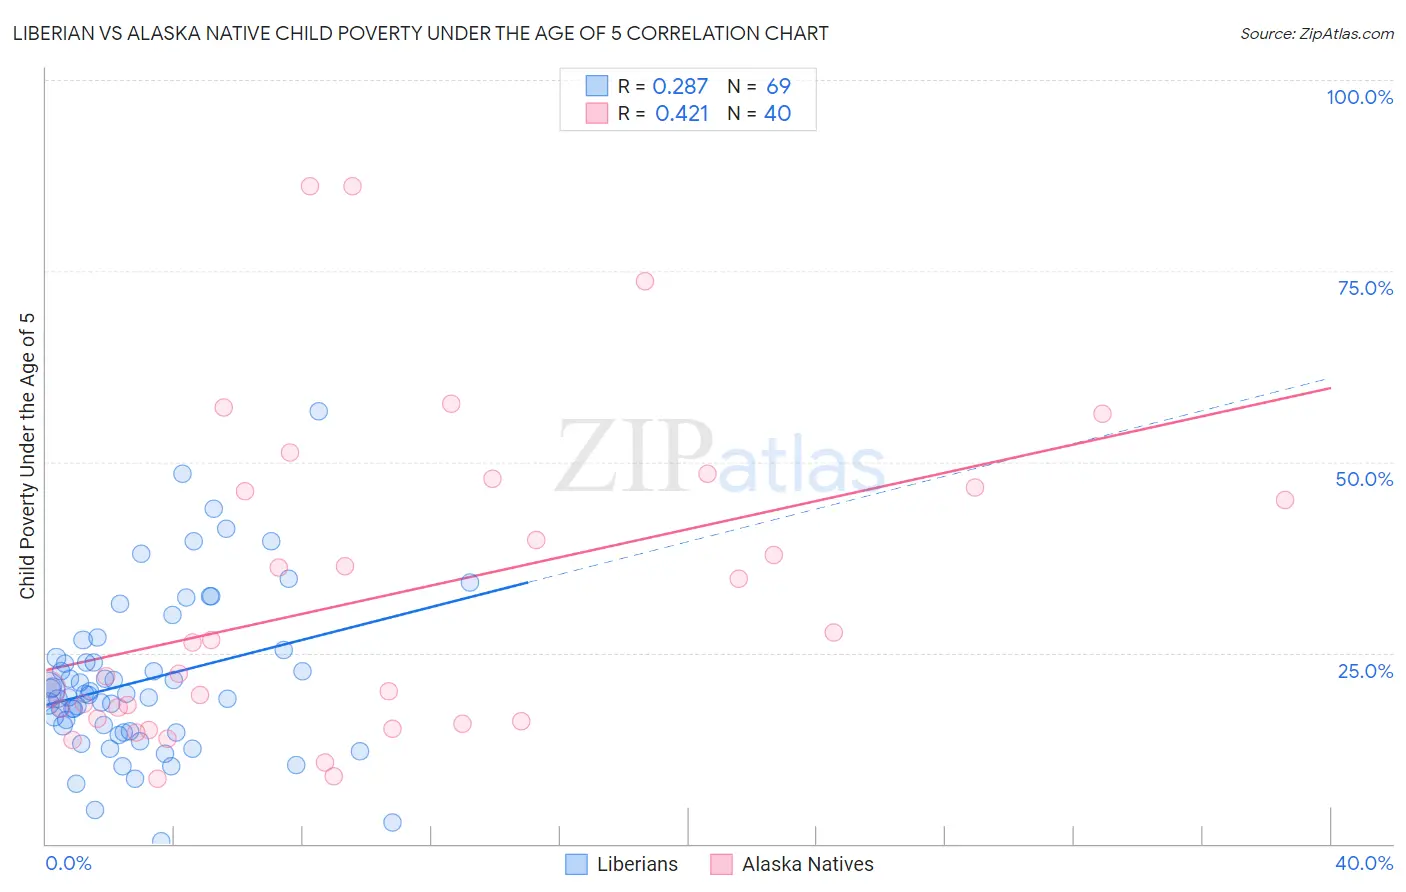
Liberian vs Alaska Native Child Poverty Under the Age of 5 Correlation Chart
The statistical analysis conducted on geographies consisting of 116,697,175 people shows a weak positive correlation between the proportion of Liberians and poverty level among children under the age of 5 in the United States with a correlation coefficient (R) of 0.287 and weighted average of 20.2%. Similarly, the statistical analysis conducted on geographies consisting of 76,221,903 people shows a moderate positive correlation between the proportion of Alaska Natives and poverty level among children under the age of 5 in the United States with a correlation coefficient (R) of 0.421 and weighted average of 19.6%, a difference of 2.9%.
Child Poverty Under the Age of 5 Correlation Summary
| Measurement | Liberian | Alaska Native |
| Minimum | 0.41% | 8.4% |
| Maximum | 56.7% | 86.0% |
| Range | 56.3% | 77.6% |
| Mean | 21.4% | 32.3% |
| Median | 19.7% | 24.3% |
| Interquartile 25% (IQ1) | 14.7% | 16.2% |
| Interquartile 75% (IQ3) | 24.9% | 46.4% |
| Interquartile Range (IQR) | 10.2% | 30.2% |
| Standard Deviation (Sample) | 10.5% | 20.5% |
| Standard Deviation (Population) | 10.4% | 20.3% |
Similar Demographics by Child Poverty Under the Age of 5
Demographics Similar to Liberians by Child Poverty Under the Age of 5
In terms of child poverty under the age of 5, the demographic groups most similar to Liberians are Barbadian (20.2%, a difference of 0.070%), Immigrants from Liberia (20.2%, a difference of 0.19%), Spanish American Indian (20.2%, a difference of 0.31%), Immigrants from Bangladesh (20.1%, a difference of 0.41%), and Aleut (20.3%, a difference of 0.43%).
| Demographics | Rating | Rank | Child Poverty Under the Age of 5 |
| Immigrants | Cuba | 0.2 /100 | #255 | Tragic 19.9% |
| Immigrants | Barbados | 0.2 /100 | #256 | Tragic 20.0% |
| Shoshone | 0.2 /100 | #257 | Tragic 20.0% |
| Immigrants | St. Vincent and the Grenadines | 0.2 /100 | #258 | Tragic 20.0% |
| Immigrants | El Salvador | 0.2 /100 | #259 | Tragic 20.0% |
| Spanish Americans | 0.2 /100 | #260 | Tragic 20.1% |
| Immigrants | Bangladesh | 0.2 /100 | #261 | Tragic 20.1% |
| Liberians | 0.1 /100 | #262 | Tragic 20.2% |
| Barbadians | 0.1 /100 | #263 | Tragic 20.2% |
| Immigrants | Liberia | 0.1 /100 | #264 | Tragic 20.2% |
| Spanish American Indians | 0.1 /100 | #265 | Tragic 20.2% |
| Aleuts | 0.1 /100 | #266 | Tragic 20.3% |
| Ottawa | 0.1 /100 | #267 | Tragic 20.3% |
| Belizeans | 0.1 /100 | #268 | Tragic 20.3% |
| Immigrants | Burma/Myanmar | 0.1 /100 | #269 | Tragic 20.4% |
Demographics Similar to Alaska Natives by Child Poverty Under the Age of 5
In terms of child poverty under the age of 5, the demographic groups most similar to Alaska Natives are Immigrants from Ecuador (19.6%, a difference of 0.060%), Immigrants from Guyana (19.6%, a difference of 0.11%), Osage (19.6%, a difference of 0.22%), Immigrants from Ghana (19.6%, a difference of 0.24%), and Immigrants from Western Africa (19.7%, a difference of 0.42%).
| Demographics | Rating | Rank | Child Poverty Under the Age of 5 |
| Immigrants | Micronesia | 0.9 /100 | #234 | Tragic 19.4% |
| Immigrants | Laos | 0.8 /100 | #235 | Tragic 19.4% |
| Immigrants | Trinidad and Tobago | 0.8 /100 | #236 | Tragic 19.4% |
| Immigrants | Cabo Verde | 0.6 /100 | #237 | Tragic 19.5% |
| Salvadorans | 0.6 /100 | #238 | Tragic 19.5% |
| Vietnamese | 0.6 /100 | #239 | Tragic 19.5% |
| Immigrants | Ecuador | 0.5 /100 | #240 | Tragic 19.6% |
| Alaska Natives | 0.5 /100 | #241 | Tragic 19.6% |
| Immigrants | Guyana | 0.5 /100 | #242 | Tragic 19.6% |
| Osage | 0.5 /100 | #243 | Tragic 19.6% |
| Immigrants | Ghana | 0.5 /100 | #244 | Tragic 19.6% |
| Immigrants | Western Africa | 0.4 /100 | #245 | Tragic 19.7% |
| Cree | 0.4 /100 | #246 | Tragic 19.7% |
| Guyanese | 0.4 /100 | #247 | Tragic 19.7% |
| Marshallese | 0.4 /100 | #248 | Tragic 19.7% |