Immigrants from India vs Alaska Native Child Poverty Under the Age of 5
COMPARE
Immigrants from India
Alaska Native
Child Poverty Under the Age of 5
Child Poverty Under the Age of 5 Comparison
Immigrants from India
Alaska Natives
11.5%
CHILD POVERTY UNDER THE AGE OF 5
100.0/ 100
METRIC RATING
1st/ 347
METRIC RANK
19.6%
CHILD POVERTY UNDER THE AGE OF 5
0.5/ 100
METRIC RATING
241st/ 347
METRIC RANK
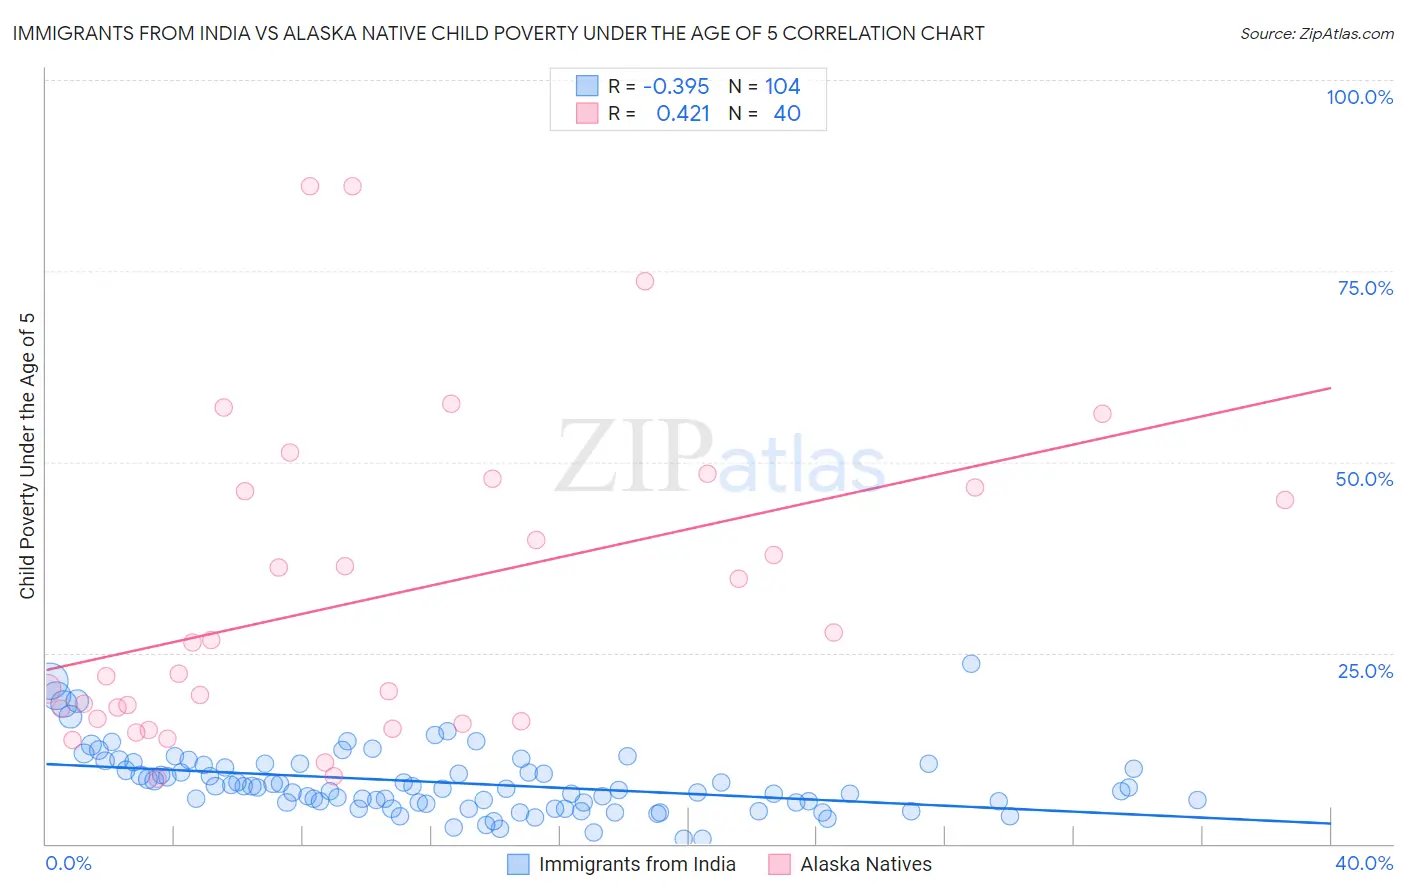
Immigrants from India vs Alaska Native Child Poverty Under the Age of 5 Correlation Chart
The statistical analysis conducted on geographies consisting of 412,787,139 people shows a mild negative correlation between the proportion of Immigrants from India and poverty level among children under the age of 5 in the United States with a correlation coefficient (R) of -0.395 and weighted average of 11.5%. Similarly, the statistical analysis conducted on geographies consisting of 76,221,903 people shows a moderate positive correlation between the proportion of Alaska Natives and poverty level among children under the age of 5 in the United States with a correlation coefficient (R) of 0.421 and weighted average of 19.6%, a difference of 70.5%.
Child Poverty Under the Age of 5 Correlation Summary
| Measurement | Immigrants from India | Alaska Native |
| Minimum | 0.63% | 8.4% |
| Maximum | 23.5% | 86.0% |
| Range | 22.9% | 77.6% |
| Mean | 8.0% | 32.3% |
| Median | 7.3% | 24.3% |
| Interquartile 25% (IQ1) | 5.4% | 16.2% |
| Interquartile 75% (IQ3) | 10.4% | 46.4% |
| Interquartile Range (IQR) | 5.0% | 30.2% |
| Standard Deviation (Sample) | 4.3% | 20.5% |
| Standard Deviation (Population) | 4.2% | 20.3% |
Similar Demographics by Child Poverty Under the Age of 5
Demographics Similar to Immigrants from India by Child Poverty Under the Age of 5
In terms of child poverty under the age of 5, the demographic groups most similar to Immigrants from India are Immigrants from Taiwan (11.6%, a difference of 0.72%), Filipino (11.6%, a difference of 0.96%), Thai (12.3%, a difference of 7.0%), Immigrants from Hong Kong (12.4%, a difference of 8.1%), and Immigrants from Singapore (12.9%, a difference of 12.5%).
| Demographics | Rating | Rank | Child Poverty Under the Age of 5 |
| Immigrants | India | 100.0 /100 | #1 | Exceptional 11.5% |
| Immigrants | Taiwan | 100.0 /100 | #2 | Exceptional 11.6% |
| Filipinos | 100.0 /100 | #3 | Exceptional 11.6% |
| Thais | 100.0 /100 | #4 | Exceptional 12.3% |
| Immigrants | Hong Kong | 100.0 /100 | #5 | Exceptional 12.4% |
| Immigrants | Singapore | 100.0 /100 | #6 | Exceptional 12.9% |
| Chinese | 100.0 /100 | #7 | Exceptional 13.1% |
| Iranians | 100.0 /100 | #8 | Exceptional 13.1% |
| Immigrants | Iran | 100.0 /100 | #9 | Exceptional 13.1% |
| Burmese | 100.0 /100 | #10 | Exceptional 13.2% |
| Immigrants | Korea | 100.0 /100 | #11 | Exceptional 13.2% |
| Immigrants | South Central Asia | 100.0 /100 | #12 | Exceptional 13.3% |
| Bhutanese | 100.0 /100 | #13 | Exceptional 13.4% |
| Okinawans | 100.0 /100 | #14 | Exceptional 13.4% |
| Indians (Asian) | 100.0 /100 | #15 | Exceptional 13.4% |
Demographics Similar to Alaska Natives by Child Poverty Under the Age of 5
In terms of child poverty under the age of 5, the demographic groups most similar to Alaska Natives are Immigrants from Ecuador (19.6%, a difference of 0.060%), Immigrants from Guyana (19.6%, a difference of 0.11%), Osage (19.6%, a difference of 0.22%), Immigrants from Ghana (19.6%, a difference of 0.24%), and Immigrants from Western Africa (19.7%, a difference of 0.42%).
| Demographics | Rating | Rank | Child Poverty Under the Age of 5 |
| Immigrants | Micronesia | 0.9 /100 | #234 | Tragic 19.4% |
| Immigrants | Laos | 0.8 /100 | #235 | Tragic 19.4% |
| Immigrants | Trinidad and Tobago | 0.8 /100 | #236 | Tragic 19.4% |
| Immigrants | Cabo Verde | 0.6 /100 | #237 | Tragic 19.5% |
| Salvadorans | 0.6 /100 | #238 | Tragic 19.5% |
| Vietnamese | 0.6 /100 | #239 | Tragic 19.5% |
| Immigrants | Ecuador | 0.5 /100 | #240 | Tragic 19.6% |
| Alaska Natives | 0.5 /100 | #241 | Tragic 19.6% |
| Immigrants | Guyana | 0.5 /100 | #242 | Tragic 19.6% |
| Osage | 0.5 /100 | #243 | Tragic 19.6% |
| Immigrants | Ghana | 0.5 /100 | #244 | Tragic 19.6% |
| Immigrants | Western Africa | 0.4 /100 | #245 | Tragic 19.7% |
| Cree | 0.4 /100 | #246 | Tragic 19.7% |
| Guyanese | 0.4 /100 | #247 | Tragic 19.7% |
| Marshallese | 0.4 /100 | #248 | Tragic 19.7% |