Dutch West Indian vs South African Child Poverty Among Boys Under 16
COMPARE
Dutch West Indian
South African
Child Poverty Among Boys Under 16
Child Poverty Among Boys Under 16 Comparison
Dutch West Indians
South Africans
21.8%
CHILD POVERTY AMONG BOYS UNDER 16
0.0/ 100
METRIC RATING
319th/ 347
METRIC RANK
15.2%
CHILD POVERTY AMONG BOYS UNDER 16
93.0/ 100
METRIC RATING
120th/ 347
METRIC RANK
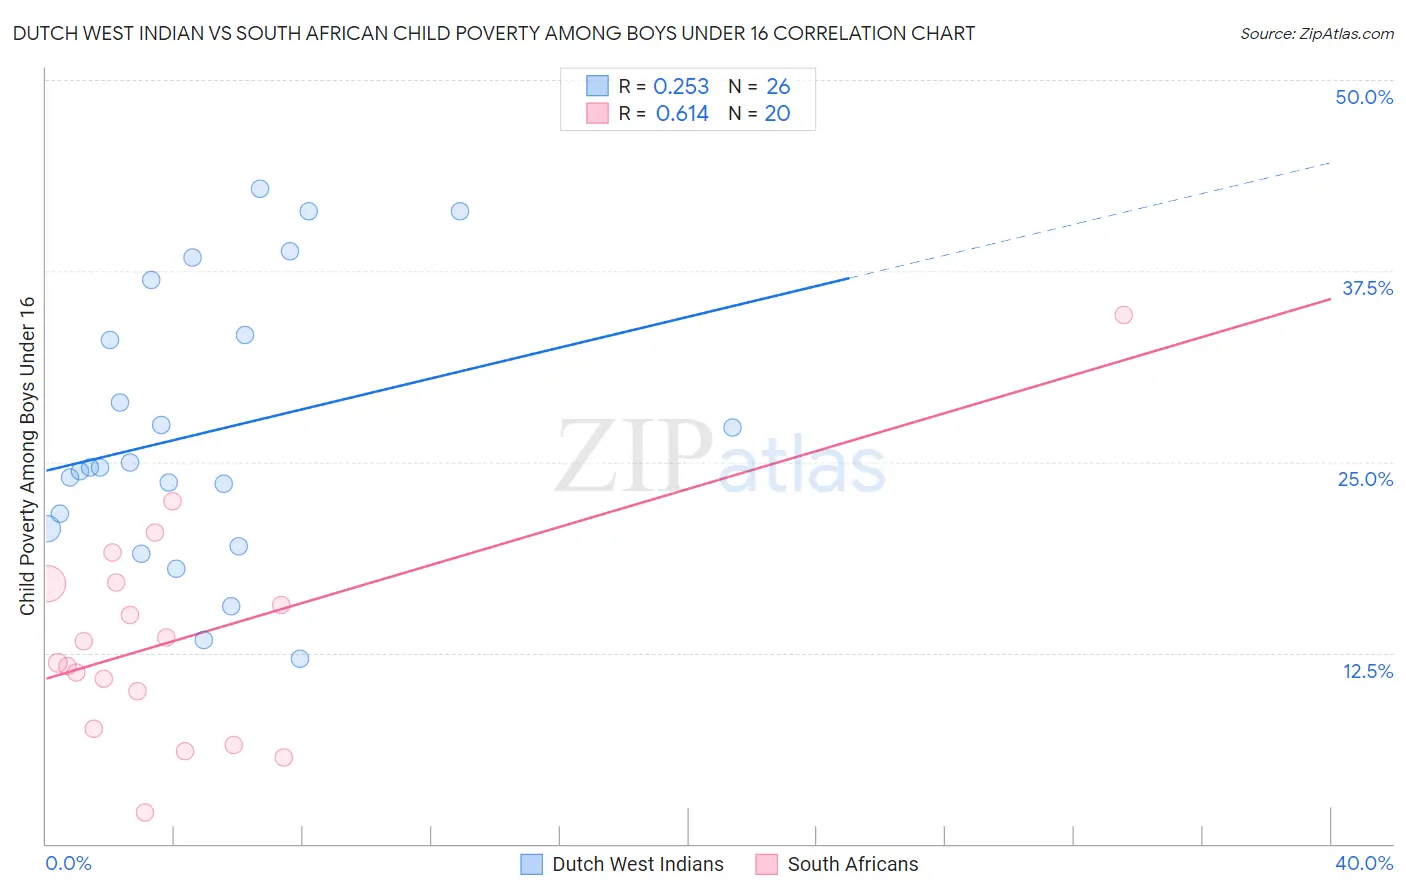
Dutch West Indian vs South African Child Poverty Among Boys Under 16 Correlation Chart
The statistical analysis conducted on geographies consisting of 85,620,916 people shows a weak positive correlation between the proportion of Dutch West Indians and poverty level among boys under the age of 16 in the United States with a correlation coefficient (R) of 0.253 and weighted average of 21.8%. Similarly, the statistical analysis conducted on geographies consisting of 180,617,887 people shows a significant positive correlation between the proportion of South Africans and poverty level among boys under the age of 16 in the United States with a correlation coefficient (R) of 0.614 and weighted average of 15.2%, a difference of 43.3%.
Child Poverty Among Boys Under 16 Correlation Summary
| Measurement | Dutch West Indian | South African |
| Minimum | 12.1% | 2.1% |
| Maximum | 42.9% | 34.6% |
| Range | 30.8% | 32.6% |
| Mean | 26.9% | 13.6% |
| Median | 24.6% | 12.5% |
| Interquartile 25% (IQ1) | 20.6% | 8.8% |
| Interquartile 75% (IQ3) | 33.3% | 17.0% |
| Interquartile Range (IQR) | 12.7% | 8.2% |
| Standard Deviation (Sample) | 8.9% | 7.2% |
| Standard Deviation (Population) | 8.7% | 7.1% |
Similar Demographics by Child Poverty Among Boys Under 16
Demographics Similar to Dutch West Indians by Child Poverty Among Boys Under 16
In terms of child poverty among boys under 16, the demographic groups most similar to Dutch West Indians are Yakama (21.7%, a difference of 0.48%), African (21.7%, a difference of 0.54%), Immigrants from Somalia (21.7%, a difference of 0.63%), Menominee (21.7%, a difference of 0.63%), and U.S. Virgin Islander (22.0%, a difference of 0.68%).
| Demographics | Rating | Rank | Child Poverty Among Boys Under 16 |
| Immigrants | Guatemala | 0.0 /100 | #312 | Tragic 21.6% |
| British West Indians | 0.0 /100 | #313 | Tragic 21.6% |
| Ute | 0.0 /100 | #314 | Tragic 21.6% |
| Immigrants | Somalia | 0.0 /100 | #315 | Tragic 21.7% |
| Menominee | 0.0 /100 | #316 | Tragic 21.7% |
| Africans | 0.0 /100 | #317 | Tragic 21.7% |
| Yakama | 0.0 /100 | #318 | Tragic 21.7% |
| Dutch West Indians | 0.0 /100 | #319 | Tragic 21.8% |
| U.S. Virgin Islanders | 0.0 /100 | #320 | Tragic 22.0% |
| Cajuns | 0.0 /100 | #321 | Tragic 22.2% |
| Immigrants | Dominica | 0.0 /100 | #322 | Tragic 22.2% |
| Hondurans | 0.0 /100 | #323 | Tragic 22.3% |
| Immigrants | Congo | 0.0 /100 | #324 | Tragic 22.4% |
| Central American Indians | 0.0 /100 | #325 | Tragic 22.5% |
| Paiute | 0.0 /100 | #326 | Tragic 22.8% |
Demographics Similar to South Africans by Child Poverty Among Boys Under 16
In terms of child poverty among boys under 16, the demographic groups most similar to South Africans are Scottish (15.2%, a difference of 0.010%), Belgian (15.2%, a difference of 0.050%), Immigrants from Malaysia (15.3%, a difference of 0.11%), Native Hawaiian (15.2%, a difference of 0.17%), and Immigrants from Vietnam (15.2%, a difference of 0.23%).
| Demographics | Rating | Rank | Child Poverty Among Boys Under 16 |
| Irish | 93.8 /100 | #113 | Exceptional 15.2% |
| Immigrants | Ukraine | 93.6 /100 | #114 | Exceptional 15.2% |
| Armenians | 93.6 /100 | #115 | Exceptional 15.2% |
| Immigrants | South Eastern Asia | 93.5 /100 | #116 | Exceptional 15.2% |
| Immigrants | Vietnam | 93.5 /100 | #117 | Exceptional 15.2% |
| Native Hawaiians | 93.4 /100 | #118 | Exceptional 15.2% |
| Belgians | 93.1 /100 | #119 | Exceptional 15.2% |
| South Africans | 93.0 /100 | #120 | Exceptional 15.2% |
| Scottish | 93.0 /100 | #121 | Exceptional 15.2% |
| Immigrants | Malaysia | 92.8 /100 | #122 | Exceptional 15.3% |
| Immigrants | Norway | 92.3 /100 | #123 | Exceptional 15.3% |
| Tlingit-Haida | 92.2 /100 | #124 | Exceptional 15.3% |
| Czechoslovakians | 92.1 /100 | #125 | Exceptional 15.3% |
| Palestinians | 91.3 /100 | #126 | Exceptional 15.4% |
| Carpatho Rusyns | 91.1 /100 | #127 | Exceptional 15.4% |