Dutch West Indian vs Immigrants from Romania Child Poverty Among Boys Under 16
COMPARE
Dutch West Indian
Immigrants from Romania
Child Poverty Among Boys Under 16
Child Poverty Among Boys Under 16 Comparison
Dutch West Indians
Immigrants from Romania
21.8%
CHILD POVERTY AMONG BOYS UNDER 16
0.0/ 100
METRIC RATING
319th/ 347
METRIC RANK
14.5%
CHILD POVERTY AMONG BOYS UNDER 16
98.5/ 100
METRIC RATING
64th/ 347
METRIC RANK
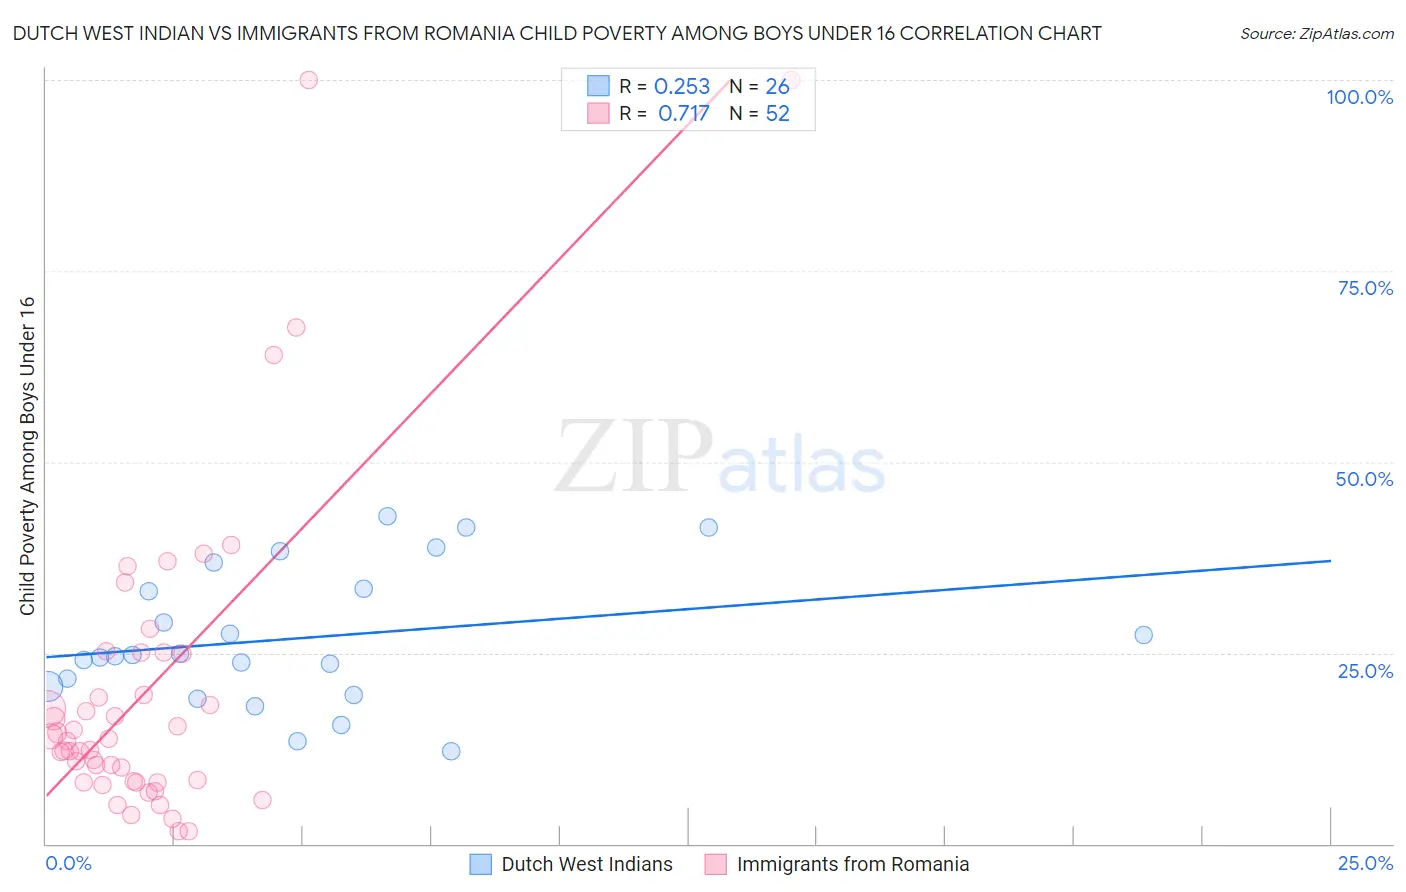
Dutch West Indian vs Immigrants from Romania Child Poverty Among Boys Under 16 Correlation Chart
The statistical analysis conducted on geographies consisting of 85,620,916 people shows a weak positive correlation between the proportion of Dutch West Indians and poverty level among boys under the age of 16 in the United States with a correlation coefficient (R) of 0.253 and weighted average of 21.8%. Similarly, the statistical analysis conducted on geographies consisting of 253,981,907 people shows a strong positive correlation between the proportion of Immigrants from Romania and poverty level among boys under the age of 16 in the United States with a correlation coefficient (R) of 0.717 and weighted average of 14.5%, a difference of 50.4%.
Child Poverty Among Boys Under 16 Correlation Summary
| Measurement | Dutch West Indian | Immigrants from Romania |
| Minimum | 12.1% | 1.6% |
| Maximum | 42.9% | 100.0% |
| Range | 30.8% | 98.4% |
| Mean | 26.9% | 20.3% |
| Median | 24.6% | 13.6% |
| Interquartile 25% (IQ1) | 20.6% | 8.1% |
| Interquartile 75% (IQ3) | 33.3% | 24.9% |
| Interquartile Range (IQR) | 12.7% | 16.8% |
| Standard Deviation (Sample) | 8.9% | 21.1% |
| Standard Deviation (Population) | 8.7% | 20.9% |
Similar Demographics by Child Poverty Among Boys Under 16
Demographics Similar to Dutch West Indians by Child Poverty Among Boys Under 16
In terms of child poverty among boys under 16, the demographic groups most similar to Dutch West Indians are Yakama (21.7%, a difference of 0.48%), African (21.7%, a difference of 0.54%), Immigrants from Somalia (21.7%, a difference of 0.63%), Menominee (21.7%, a difference of 0.63%), and U.S. Virgin Islander (22.0%, a difference of 0.68%).
| Demographics | Rating | Rank | Child Poverty Among Boys Under 16 |
| Immigrants | Guatemala | 0.0 /100 | #312 | Tragic 21.6% |
| British West Indians | 0.0 /100 | #313 | Tragic 21.6% |
| Ute | 0.0 /100 | #314 | Tragic 21.6% |
| Immigrants | Somalia | 0.0 /100 | #315 | Tragic 21.7% |
| Menominee | 0.0 /100 | #316 | Tragic 21.7% |
| Africans | 0.0 /100 | #317 | Tragic 21.7% |
| Yakama | 0.0 /100 | #318 | Tragic 21.7% |
| Dutch West Indians | 0.0 /100 | #319 | Tragic 21.8% |
| U.S. Virgin Islanders | 0.0 /100 | #320 | Tragic 22.0% |
| Cajuns | 0.0 /100 | #321 | Tragic 22.2% |
| Immigrants | Dominica | 0.0 /100 | #322 | Tragic 22.2% |
| Hondurans | 0.0 /100 | #323 | Tragic 22.3% |
| Immigrants | Congo | 0.0 /100 | #324 | Tragic 22.4% |
| Central American Indians | 0.0 /100 | #325 | Tragic 22.5% |
| Paiute | 0.0 /100 | #326 | Tragic 22.8% |
Demographics Similar to Immigrants from Romania by Child Poverty Among Boys Under 16
In terms of child poverty among boys under 16, the demographic groups most similar to Immigrants from Romania are Soviet Union (14.5%, a difference of 0.030%), Immigrants from Bulgaria (14.5%, a difference of 0.030%), Immigrants from Europe (14.5%, a difference of 0.060%), Cambodian (14.5%, a difference of 0.13%), and Slovene (14.5%, a difference of 0.15%).
| Demographics | Rating | Rank | Child Poverty Among Boys Under 16 |
| Poles | 98.9 /100 | #57 | Exceptional 14.4% |
| Immigrants | Sweden | 98.9 /100 | #58 | Exceptional 14.4% |
| Immigrants | Czechoslovakia | 98.9 /100 | #59 | Exceptional 14.4% |
| Immigrants | Belgium | 98.9 /100 | #60 | Exceptional 14.4% |
| Scandinavians | 98.8 /100 | #61 | Exceptional 14.4% |
| Immigrants | Israel | 98.7 /100 | #62 | Exceptional 14.4% |
| Cambodians | 98.5 /100 | #63 | Exceptional 14.5% |
| Immigrants | Romania | 98.5 /100 | #64 | Exceptional 14.5% |
| Soviet Union | 98.5 /100 | #65 | Exceptional 14.5% |
| Immigrants | Bulgaria | 98.5 /100 | #66 | Exceptional 14.5% |
| Immigrants | Europe | 98.4 /100 | #67 | Exceptional 14.5% |
| Slovenes | 98.4 /100 | #68 | Exceptional 14.5% |
| Immigrants | Austria | 98.4 /100 | #69 | Exceptional 14.5% |
| Europeans | 98.4 /100 | #70 | Exceptional 14.5% |
| Immigrants | Netherlands | 98.1 /100 | #71 | Exceptional 14.6% |