Immigrants from Barbados vs Lithuanian Single Father Poverty
COMPARE
Immigrants from Barbados
Lithuanian
Single Father Poverty
Single Father Poverty Comparison
Immigrants from Barbados
Lithuanians
16.5%
SINGLE FATHER POVERTY
24.3/ 100
METRIC RATING
195th/ 347
METRIC RANK
17.3%
SINGLE FATHER POVERTY
0.4/ 100
METRIC RATING
263rd/ 347
METRIC RANK
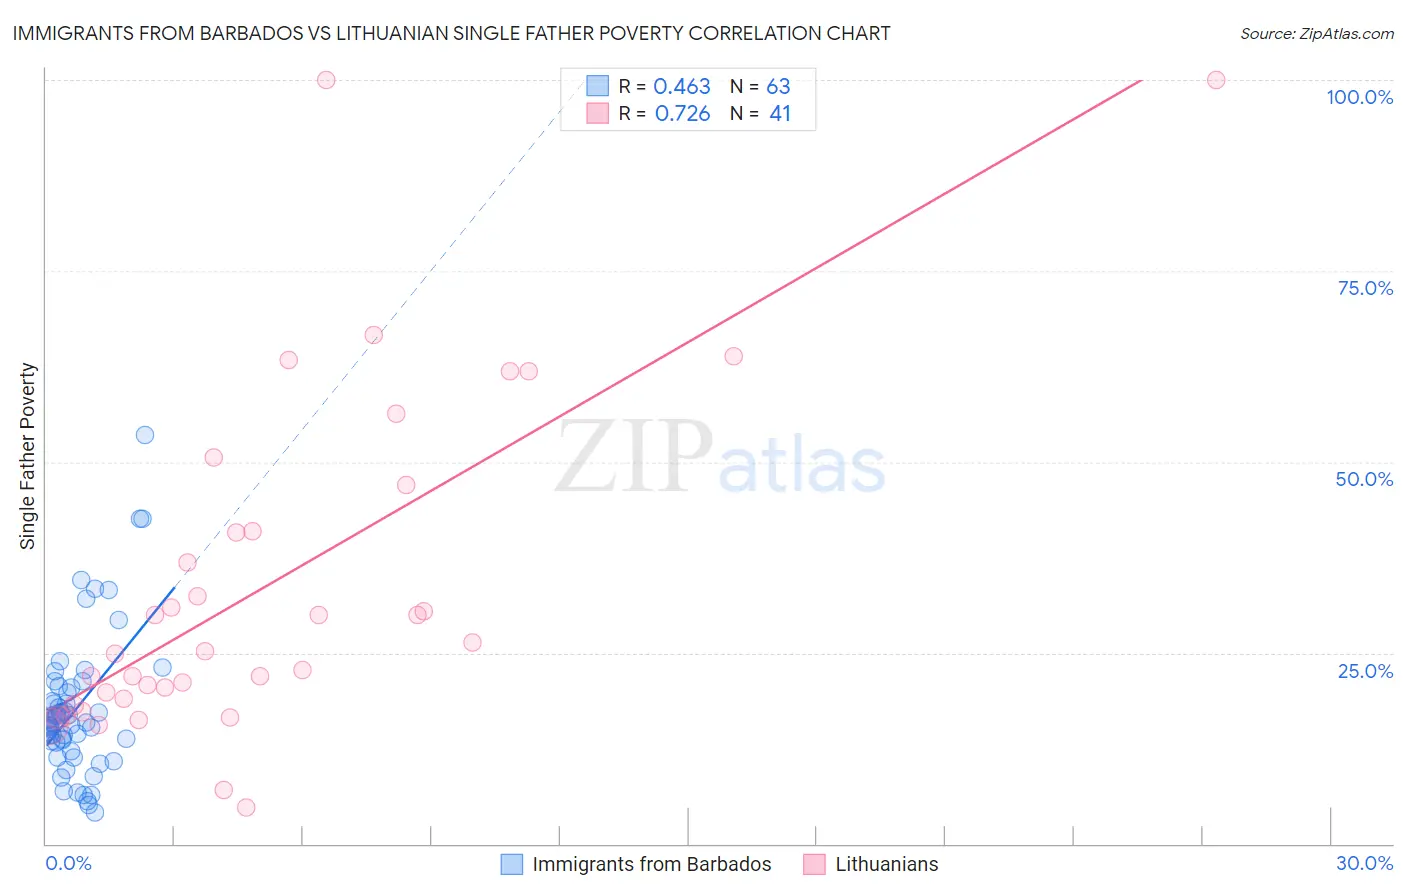
Immigrants from Barbados vs Lithuanian Single Father Poverty Correlation Chart
The statistical analysis conducted on geographies consisting of 102,804,333 people shows a moderate positive correlation between the proportion of Immigrants from Barbados and poverty level among single fathers in the United States with a correlation coefficient (R) of 0.463 and weighted average of 16.5%. Similarly, the statistical analysis conducted on geographies consisting of 319,660,804 people shows a strong positive correlation between the proportion of Lithuanians and poverty level among single fathers in the United States with a correlation coefficient (R) of 0.726 and weighted average of 17.3%, a difference of 4.8%.
Single Father Poverty Correlation Summary
| Measurement | Immigrants from Barbados | Lithuanian |
| Minimum | 4.0% | 4.8% |
| Maximum | 53.6% | 100.0% |
| Range | 49.6% | 95.2% |
| Mean | 17.6% | 33.8% |
| Median | 15.8% | 25.2% |
| Interquartile 25% (IQ1) | 13.3% | 18.5% |
| Interquartile 75% (IQ3) | 20.4% | 44.0% |
| Interquartile Range (IQR) | 7.1% | 25.5% |
| Standard Deviation (Sample) | 9.3% | 22.3% |
| Standard Deviation (Population) | 9.3% | 22.1% |
Similar Demographics by Single Father Poverty
Demographics Similar to Immigrants from Barbados by Single Father Poverty
In terms of single father poverty, the demographic groups most similar to Immigrants from Barbados are Cape Verdean (16.5%, a difference of 0.0%), Ecuadorian (16.5%, a difference of 0.010%), Immigrants from Switzerland (16.5%, a difference of 0.030%), Immigrants from Canada (16.5%, a difference of 0.15%), and Immigrants from Guyana (16.5%, a difference of 0.16%).
| Demographics | Rating | Rank | Single Father Poverty |
| Russians | 30.1 /100 | #188 | Fair 16.4% |
| Latvians | 28.9 /100 | #189 | Fair 16.5% |
| Immigrants | Burma/Myanmar | 28.0 /100 | #190 | Fair 16.5% |
| Immigrants | Guyana | 27.1 /100 | #191 | Fair 16.5% |
| Immigrants | Switzerland | 24.8 /100 | #192 | Fair 16.5% |
| Ecuadorians | 24.5 /100 | #193 | Fair 16.5% |
| Cape Verdeans | 24.4 /100 | #194 | Fair 16.5% |
| Immigrants | Barbados | 24.3 /100 | #195 | Fair 16.5% |
| Immigrants | Canada | 21.9 /100 | #196 | Fair 16.5% |
| Immigrants | Northern Europe | 20.3 /100 | #197 | Fair 16.5% |
| Romanians | 20.1 /100 | #198 | Fair 16.5% |
| Immigrants | Belize | 19.8 /100 | #199 | Poor 16.5% |
| Syrians | 17.4 /100 | #200 | Poor 16.6% |
| Cubans | 16.5 /100 | #201 | Poor 16.6% |
| Immigrants | Croatia | 16.5 /100 | #202 | Poor 16.6% |
Demographics Similar to Lithuanians by Single Father Poverty
In terms of single father poverty, the demographic groups most similar to Lithuanians are Immigrants from Zaire (17.3%, a difference of 0.010%), Swiss (17.3%, a difference of 0.14%), Slovene (17.3%, a difference of 0.20%), Polish (17.3%, a difference of 0.21%), and Jamaican (17.3%, a difference of 0.26%).
| Demographics | Rating | Rank | Single Father Poverty |
| Immigrants | Haiti | 0.8 /100 | #256 | Tragic 17.2% |
| Immigrants | Albania | 0.7 /100 | #257 | Tragic 17.2% |
| Albanians | 0.7 /100 | #258 | Tragic 17.2% |
| Immigrants | Jamaica | 0.7 /100 | #259 | Tragic 17.2% |
| Spaniards | 0.6 /100 | #260 | Tragic 17.2% |
| Swiss | 0.5 /100 | #261 | Tragic 17.3% |
| Immigrants | Zaire | 0.4 /100 | #262 | Tragic 17.3% |
| Lithuanians | 0.4 /100 | #263 | Tragic 17.3% |
| Slovenes | 0.3 /100 | #264 | Tragic 17.3% |
| Poles | 0.3 /100 | #265 | Tragic 17.3% |
| Jamaicans | 0.3 /100 | #266 | Tragic 17.3% |
| Haitians | 0.3 /100 | #267 | Tragic 17.3% |
| Immigrants | Caribbean | 0.3 /100 | #268 | Tragic 17.4% |
| Slavs | 0.3 /100 | #269 | Tragic 17.4% |
| Indonesians | 0.2 /100 | #270 | Tragic 17.4% |