Dutch vs Immigrants from Bangladesh Child Poverty Under the Age of 5

COMPARE

Dutch
Race
Ancestry
AfghanAfricanAlaska NativeAlaskan AthabascanAlbanianAleutAlsatianAmericanApacheArabArapahoArgentineanArmenianAssyrian/Chaldean/SyriacAustralianAustrianBahamianBangladeshiBarbadianBasqueBelgianBelizeanBermudanBhutaneseBlackfeetBolivianBrazilianBritishBritish West IndianBulgarianBurmeseCajunCambodianCanadianCape VerdeanCarpatho RusynCelticCentral AmericanCentral American IndianCherokeeCheyenneChickasawChileanChineseChippewaChoctawColombianColvilleComancheCosta RicanCreeCreekCroatianCrowCubanCypriotCzechCzechoslovakianDanishDelawareDominicanDutchDutch West IndianEastern EuropeanEcuadorianEgyptianEnglishEstonianEthiopianEuropeanFijianFilipinoFinnishFrenchFrench American IndianFrench CanadianGermanGerman RussianGhanaianGreekGuamanian/ChamorroGuatemalanGuyaneseHaitianHmongHonduranHopiHoumaHungarianIcelanderIndian (Asian)IndonesianInupiatIranianIraqiIrishIroquoisIsraeliItalianJamaicanJapaneseJordanianKenyanKiowaKoreanLaotianLatvianLebaneseLiberianLithuanianLumbeeLuxembourgerMacedonianMalaysianMalteseMarshalleseMenomineeMexicanMexican American IndianMongolianMoroccanNative HawaiianNavajoNepaleseNew ZealanderNicaraguanNigerianNorthern EuropeanNorwegianOkinawanOsageOttawaPaiutePakistaniPalestinianPanamanianParaguayanPennsylvania GermanPeruvianPimaPolishPortuguesePotawatomiPuebloPuerto RicanPuget Sound SalishRomanianRussianSalvadoranSamoanScandinavianScotch-IrishScottishSeminoleSenegaleseSerbianShoshoneSierra LeoneanSiouxSlavicSlovakSloveneSomaliSouth AfricanSouth AmericanSouth American IndianSoviet UnionSpaniardSpanishSpanish AmericanSpanish American IndianSri LankanSubsaharan AfricanSudaneseSwedishSwissSyrianTaiwaneseThaiTlingit-HaidaTohono O'OdhamTonganTrinidadian and TobagonianTsimshianTurkishU.S. Virgin IslanderUgandanUkrainianUruguayanUteVenezuelanVietnameseWelshWest IndianYakamaYaquiYugoslavianYumanYup'ikZimbabwean
Immigration
NonimmigrantsImmigrantsAfghanistanAfricaAlbaniaArgentinaArmeniaAsiaAustraliaAustriaBahamasBarbadosBelarusBelgiumBelizeBoliviaBosnia and HerzegovinaBrazilBulgariaBurma/MyanmarCabo VerdeCambodiaCameroonCanadaCaribbeanCentral AmericaChileChinaColombiaCongoCosta RicaCroatiaCubaCzechoslovakiaDenmarkDominicaDominican RepublicEastern AfricaEastern AsiaEastern EuropeEcuadorEgyptEl SalvadorEnglandEritreaEthiopiaEuropeFijiFranceGermanyGhanaGreeceGrenadaGuatemalaGuyanaHaitiHondurasHong KongHungaryIndiaIndonesiaIranIraqIrelandIsraelItalyJamaicaJapanJordanKazakhstanKenyaKoreaKuwaitLaosLatin AmericaLatviaLebanonLiberiaLithuaniaMalaysiaMexicoMicronesiaMiddle AfricaMoldovaMoroccoNepalNetherlandsNicaraguaNigeriaNorth AmericaNorth MacedoniaNorthern AfricaNorthern EuropeNorwayOceaniaPakistanPanamaPeruPhilippinesPolandPortugalRomaniaRussiaSaudi ArabiaScotlandSenegalSerbiaSierra LeoneSingaporeSomaliaSouth AfricaSouth AmericaSouth Central AsiaSouth Eastern AsiaSouthern EuropeSpainSri LankaSt. Vincent and the GrenadinesSudanSwedenSwitzerlandSyriaTaiwanThailandTrinidad and TobagoTurkeyUgandaUkraineUruguayUzbekistanVenezuelaVietnamWest IndiesWestern AfricaWestern AsiaWestern EuropeYemenZaireZimbabweAzores
Immigrants from Bangladesh
Race
Ancestry
AfghanAfricanAlaska NativeAlaskan AthabascanAlbanianAleutAlsatianAmericanApacheArabArapahoArgentineanArmenianAssyrian/Chaldean/SyriacAustralianAustrianBahamianBangladeshiBarbadianBasqueBelgianBelizeanBermudanBhutaneseBlackfeetBolivianBrazilianBritishBritish West IndianBulgarianBurmeseCajunCambodianCanadianCape VerdeanCarpatho RusynCelticCentral AmericanCentral American IndianCherokeeCheyenneChickasawChileanChineseChippewaChoctawColombianColvilleComancheCosta RicanCreeCreekCroatianCrowCubanCypriotCzechCzechoslovakianDanishDelawareDominicanDutch West IndianEastern EuropeanEcuadorianEgyptianEnglishEstonianEthiopianEuropeanFijianFilipinoFinnishFrenchFrench American IndianFrench CanadianGermanGerman RussianGhanaianGreekGuamanian/ChamorroGuatemalanGuyaneseHaitianHmongHonduranHopiHoumaHungarianIcelanderIndian (Asian)IndonesianInupiatIranianIraqiIrishIroquoisIsraeliItalianJamaicanJapaneseJordanianKenyanKiowaKoreanLaotianLatvianLebaneseLiberianLithuanianLumbeeLuxembourgerMacedonianMalaysianMalteseMarshalleseMenomineeMexicanMexican American IndianMongolianMoroccanNative HawaiianNavajoNepaleseNew ZealanderNicaraguanNigerianNorthern EuropeanNorwegianOkinawanOsageOttawaPaiutePakistaniPalestinianPanamanianParaguayanPennsylvania GermanPeruvianPimaPolishPortuguesePotawatomiPuebloPuerto RicanPuget Sound SalishRomanianRussianSalvadoranSamoanScandinavianScotch-IrishScottishSeminoleSenegaleseSerbianShoshoneSierra LeoneanSiouxSlavicSlovakSloveneSomaliSouth AfricanSouth AmericanSouth American IndianSoviet UnionSpaniardSpanishSpanish AmericanSpanish American IndianSri LankanSubsaharan AfricanSudaneseSwedishSwissSyrianTaiwaneseThaiTlingit-HaidaTohono O'OdhamTonganTrinidadian and TobagonianTsimshianTurkishU.S. Virgin IslanderUgandanUkrainianUruguayanUteVenezuelanVietnameseWelshWest IndianYakamaYaquiYugoslavianYumanYup'ikZimbabwean
Immigration
NonimmigrantsImmigrantsAfghanistanAfricaAlbaniaArgentinaArmeniaAsiaAustraliaAustriaBahamasBangladeshBarbadosBelarusBelgiumBelizeBoliviaBosnia and HerzegovinaBrazilBulgariaBurma/MyanmarCabo VerdeCambodiaCameroonCanadaCaribbeanCentral AmericaChileChinaColombiaCongoCosta RicaCroatiaCubaCzechoslovakiaDenmarkDominicaDominican RepublicEastern AfricaEastern AsiaEastern EuropeEcuadorEgyptEl SalvadorEnglandEritreaEthiopiaEuropeFijiFranceGermanyGhanaGreeceGrenadaGuatemalaGuyanaHaitiHondurasHong KongHungaryIndiaIndonesiaIranIraqIrelandIsraelItalyJamaicaJapanJordanKazakhstanKenyaKoreaKuwaitLaosLatin AmericaLatviaLebanonLiberiaLithuaniaMalaysiaMexicoMicronesiaMiddle AfricaMoldovaMoroccoNepalNetherlandsNicaraguaNigeriaNorth AmericaNorth MacedoniaNorthern AfricaNorthern EuropeNorwayOceaniaPakistanPanamaPeruPhilippinesPolandPortugalRomaniaRussiaSaudi ArabiaScotlandSenegalSerbiaSierra LeoneSingaporeSomaliaSouth AfricaSouth AmericaSouth Central AsiaSouth Eastern AsiaSouthern EuropeSpainSri LankaSt. Vincent and the GrenadinesSudanSwedenSwitzerlandSyriaTaiwanThailandTrinidad and TobagoTurkeyUgandaUkraineUruguayUzbekistanVenezuelaVietnamWest IndiesWestern AfricaWestern AsiaWestern EuropeYemenZaireZimbabweAzores
Child Poverty Under the Age of 5
Income
Poverty
Unemployment
Labor Participation
Family Structure
Vehicle Availability
Education Level
Disability

Child Poverty Under the Age of 5 Comparison

Dutch

Immigrants from Bangladesh

Good
Tragic
16.7%
CHILD POVERTY UNDER THE AGE OF 5
77.1/ 100
METRIC RATING
153rd/ 347
METRIC RANK
20.1%
CHILD POVERTY UNDER THE AGE OF 5
0.2/ 100
METRIC RATING
261st/ 347
METRIC RANK

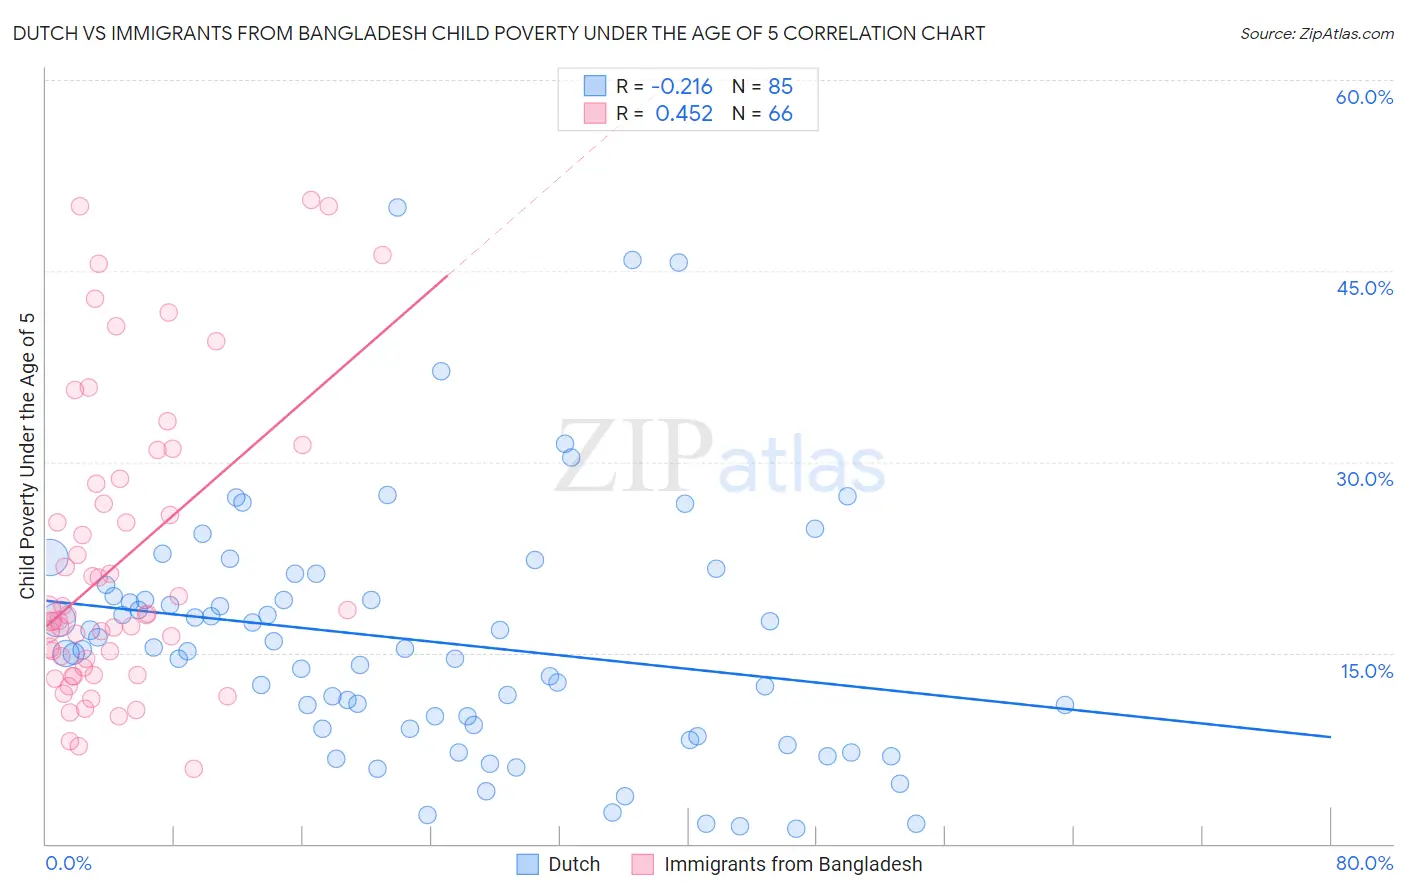
Dutch vs Immigrants from Bangladesh Child Poverty Under the Age of 5 Correlation Chart

The statistical analysis conducted on geographies consisting of 516,653,968 people shows a weak negative correlation between the proportion of Dutch and poverty level among children under the age of 5 in the United States with a correlation coefficient (R) of -0.216 and weighted average of 16.7%. Similarly, the statistical analysis conducted on geographies consisting of 199,139,388 people shows a moderate positive correlation between the proportion of Immigrants from Bangladesh and poverty level among children under the age of 5 in the United States with a correlation coefficient (R) of 0.452 and weighted average of 20.1%, a difference of 20.4%.
Dutch vs Immigrants from Bangladesh Child Poverty Under the Age of 5

Child Poverty Under the Age of 5 Correlation Summary

MeasurementDutchImmigrants from Bangladesh
Minimum1.2%5.9%
Maximum50.0%50.6%
Range48.8%44.7%
Mean15.9%22.1%
Median15.3%18.0%
Interquartile 25% (IQ1)9.0%13.8%
Interquartile 75% (IQ3)19.9%28.2%
Interquartile Range (IQR)10.9%14.4%
Standard Deviation (Sample)9.7%11.5%
Standard Deviation (Population)9.6%11.4%

Similar Demographics by Child Poverty Under the Age of 5

Demographics Similar to Dutch by Child Poverty Under the Age of 5

In terms of child poverty under the age of 5, the demographic groups most similar to Dutch are Belgian (16.7%, a difference of 0.020%), Canadian (16.7%, a difference of 0.080%), Colombian (16.7%, a difference of 0.11%), Immigrants from Venezuela (16.7%, a difference of 0.16%), and New Zealander (16.6%, a difference of 0.26%).
DemographicsRating | RankChild Poverty Under the Age of 5
Israelis
82.0
/100
|
#146
Excellent
16.6%
Immigrants | Nepal
80.3
/100
|
#147
Excellent
16.6%
Syrians
79.1
/100
|
#148
Good
16.6%
New Zealanders
78.7
/100
|
#149
Good
16.6%
Colombians
77.8
/100
|
#150
Good
16.7%
Canadians
77.6
/100
|
#151
Good
16.7%
Belgians
77.2
/100
|
#152
Good
16.7%
Dutch
77.1
/100
|
#153
Good
16.7%
Immigrants | Venezuela
76.0
/100
|
#154
Good
16.7%
South Americans
75.1
/100
|
#155
Good
16.7%
Afghans
74.4
/100
|
#156
Good
16.8%
Venezuelans
73.7
/100
|
#157
Good
16.8%
Czechoslovakians
72.5
/100
|
#158
Good
16.8%
Immigrants | Syria
72.3
/100
|
#159
Good
16.8%
Irish
72.0
/100
|
#160
Good
16.8%

Demographics Similar to Immigrants from Bangladesh by Child Poverty Under the Age of 5

In terms of child poverty under the age of 5, the demographic groups most similar to Immigrants from Bangladesh are Spanish American (20.1%, a difference of 0.040%), Liberian (20.2%, a difference of 0.41%), Immigrants from El Salvador (20.0%, a difference of 0.44%), Immigrants from St. Vincent and the Grenadines (20.0%, a difference of 0.46%), and Barbadian (20.2%, a difference of 0.48%).
DemographicsRating | RankChild Poverty Under the Age of 5
Fijians
0.3
/100
|
#254
Tragic
19.9%
Immigrants | Cuba
0.2
/100
|
#255
Tragic
19.9%
Immigrants | Barbados
0.2
/100
|
#256
Tragic
20.0%
Shoshone
0.2
/100
|
#257
Tragic
20.0%
Immigrants | St. Vincent and the Grenadines
0.2
/100
|
#258
Tragic
20.0%
Immigrants | El Salvador
0.2
/100
|
#259
Tragic
20.0%
Spanish Americans
0.2
/100
|
#260
Tragic
20.1%
Immigrants | Bangladesh
0.2
/100
|
#261
Tragic
20.1%
Liberians
0.1
/100
|
#262
Tragic
20.2%
Barbadians
0.1
/100
|
#263
Tragic
20.2%
Immigrants | Liberia
0.1
/100
|
#264
Tragic
20.2%
Spanish American Indians
0.1
/100
|
#265
Tragic
20.2%
Aleuts
0.1
/100
|
#266
Tragic
20.3%
Ottawa
0.1
/100
|
#267
Tragic
20.3%
Belizeans
0.1
/100
|
#268
Tragic
20.3%