Australian vs Mexican American Indian Seniors Poverty Over the Age of 75
COMPARE
Australian
Mexican American Indian
Seniors Poverty Over the Age of 75
Seniors Poverty Over the Age of 75 Comparison
Australians
Mexican American Indians
11.5%
SENIORS POVERTY OVER THE AGE OF 75
94.6/ 100
METRIC RATING
86th/ 347
METRIC RANK
13.6%
SENIORS POVERTY OVER THE AGE OF 75
0.3/ 100
METRIC RATING
250th/ 347
METRIC RANK
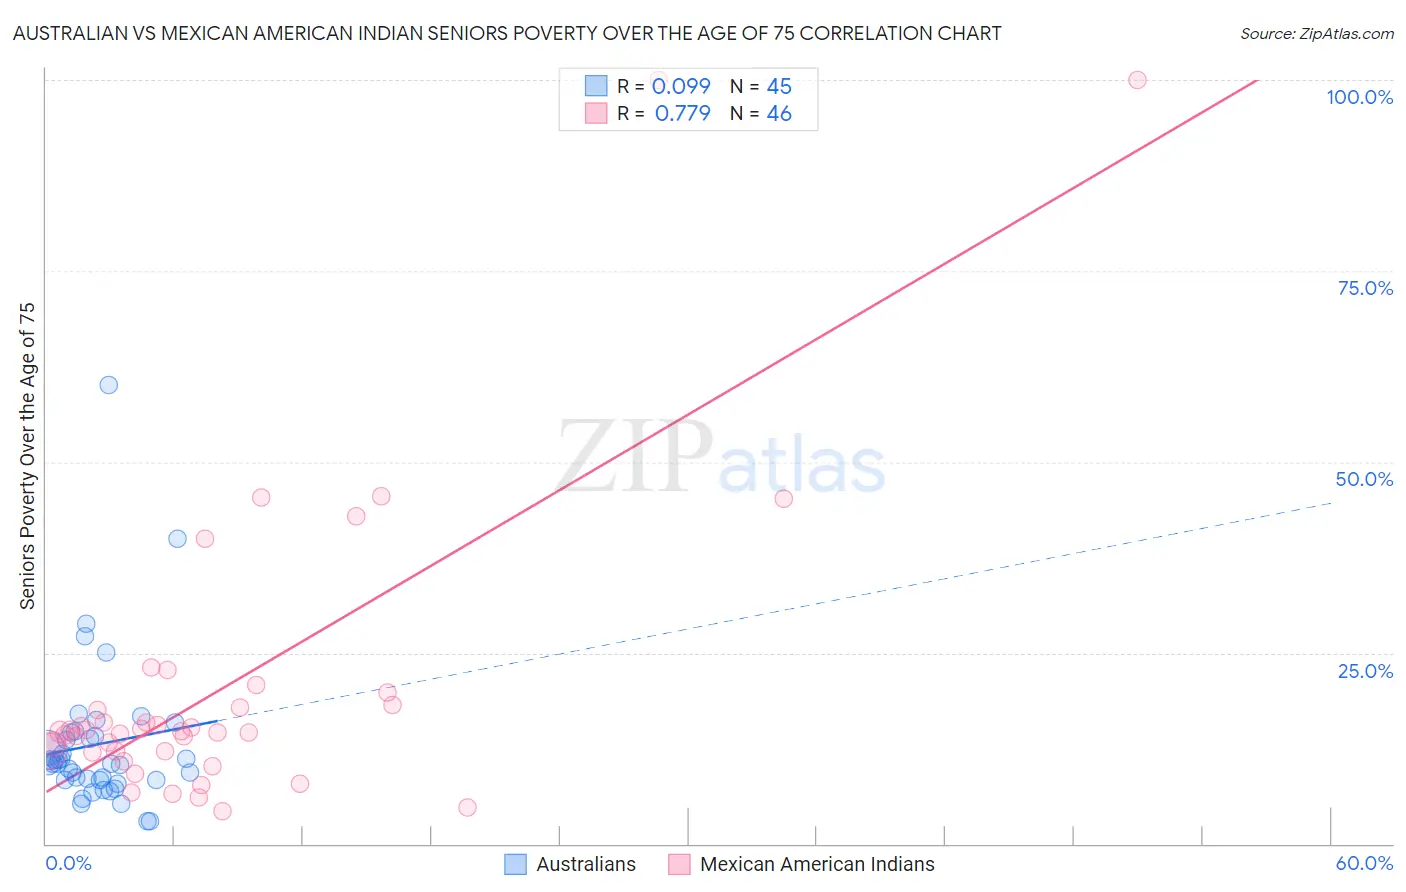
Australian vs Mexican American Indian Seniors Poverty Over the Age of 75 Correlation Chart
The statistical analysis conducted on geographies consisting of 222,582,409 people shows a slight positive correlation between the proportion of Australians and poverty level among seniors over the age of 75 in the United States with a correlation coefficient (R) of 0.099 and weighted average of 11.5%. Similarly, the statistical analysis conducted on geographies consisting of 314,926,710 people shows a strong positive correlation between the proportion of Mexican American Indians and poverty level among seniors over the age of 75 in the United States with a correlation coefficient (R) of 0.779 and weighted average of 13.6%, a difference of 18.6%.
Seniors Poverty Over the Age of 75 Correlation Summary
| Measurement | Australian | Mexican American Indian |
| Minimum | 2.9% | 4.2% |
| Maximum | 60.0% | 100.0% |
| Range | 57.1% | 95.8% |
| Mean | 13.0% | 20.6% |
| Median | 10.5% | 14.7% |
| Interquartile 25% (IQ1) | 8.3% | 12.1% |
| Interquartile 75% (IQ3) | 14.3% | 18.1% |
| Interquartile Range (IQR) | 6.0% | 6.1% |
| Standard Deviation (Sample) | 9.9% | 20.0% |
| Standard Deviation (Population) | 9.8% | 19.8% |
Similar Demographics by Seniors Poverty Over the Age of 75
Demographics Similar to Australians by Seniors Poverty Over the Age of 75
In terms of seniors poverty over the age of 75, the demographic groups most similar to Australians are Immigrants from Bulgaria (11.5%, a difference of 0.020%), Korean (11.5%, a difference of 0.030%), Immigrants from Croatia (11.5%, a difference of 0.050%), Immigrants from Sri Lanka (11.5%, a difference of 0.080%), and Immigrants from Iraq (11.5%, a difference of 0.12%).
| Demographics | Rating | Rank | Seniors Poverty Over the Age of 75 |
| Filipinos | 95.5 /100 | #79 | Exceptional 11.4% |
| Alaska Natives | 95.4 /100 | #80 | Exceptional 11.4% |
| Basques | 95.1 /100 | #81 | Exceptional 11.5% |
| Iranians | 95.1 /100 | #82 | Exceptional 11.5% |
| Immigrants | South Africa | 94.9 /100 | #83 | Exceptional 11.5% |
| Immigrants | Iraq | 94.9 /100 | #84 | Exceptional 11.5% |
| Immigrants | Bulgaria | 94.7 /100 | #85 | Exceptional 11.5% |
| Australians | 94.6 /100 | #86 | Exceptional 11.5% |
| Koreans | 94.5 /100 | #87 | Exceptional 11.5% |
| Immigrants | Croatia | 94.5 /100 | #88 | Exceptional 11.5% |
| Immigrants | Sri Lanka | 94.4 /100 | #89 | Exceptional 11.5% |
| Aleuts | 94.1 /100 | #90 | Exceptional 11.5% |
| Immigrants | Germany | 94.1 /100 | #91 | Exceptional 11.5% |
| Kenyans | 93.9 /100 | #92 | Exceptional 11.5% |
| Immigrants | Poland | 92.9 /100 | #93 | Exceptional 11.6% |
Demographics Similar to Mexican American Indians by Seniors Poverty Over the Age of 75
In terms of seniors poverty over the age of 75, the demographic groups most similar to Mexican American Indians are Immigrants from Albania (13.6%, a difference of 0.010%), African (13.6%, a difference of 0.020%), Immigrants from Ukraine (13.6%, a difference of 0.050%), Immigrants from Peru (13.7%, a difference of 0.33%), and Immigrants from Argentina (13.7%, a difference of 0.38%).
| Demographics | Rating | Rank | Seniors Poverty Over the Age of 75 |
| Dutch West Indians | 0.6 /100 | #243 | Tragic 13.5% |
| Spanish Americans | 0.5 /100 | #244 | Tragic 13.5% |
| Uruguayans | 0.5 /100 | #245 | Tragic 13.5% |
| Immigrants | Cambodia | 0.4 /100 | #246 | Tragic 13.6% |
| Immigrants | Ukraine | 0.3 /100 | #247 | Tragic 13.6% |
| Africans | 0.3 /100 | #248 | Tragic 13.6% |
| Immigrants | Albania | 0.3 /100 | #249 | Tragic 13.6% |
| Mexican American Indians | 0.3 /100 | #250 | Tragic 13.6% |
| Immigrants | Peru | 0.3 /100 | #251 | Tragic 13.7% |
| Immigrants | Argentina | 0.3 /100 | #252 | Tragic 13.7% |
| Immigrants | Spain | 0.2 /100 | #253 | Tragic 13.7% |
| Blackfeet | 0.2 /100 | #254 | Tragic 13.7% |
| Immigrants | Belarus | 0.2 /100 | #255 | Tragic 13.8% |
| Inupiat | 0.1 /100 | #256 | Tragic 13.8% |
| Immigrants | Western Africa | 0.1 /100 | #257 | Tragic 13.9% |