Yaqui vs Central American Indian Seniors Poverty Over the Age of 75
COMPARE
Yaqui
Central American Indian
Seniors Poverty Over the Age of 75
Seniors Poverty Over the Age of 75 Comparison
Yaqui
Central American Indians
12.5%
SENIORS POVERTY OVER THE AGE OF 75
25.9/ 100
METRIC RATING
187th/ 347
METRIC RANK
16.5%
SENIORS POVERTY OVER THE AGE OF 75
0.0/ 100
METRIC RATING
323rd/ 347
METRIC RANK
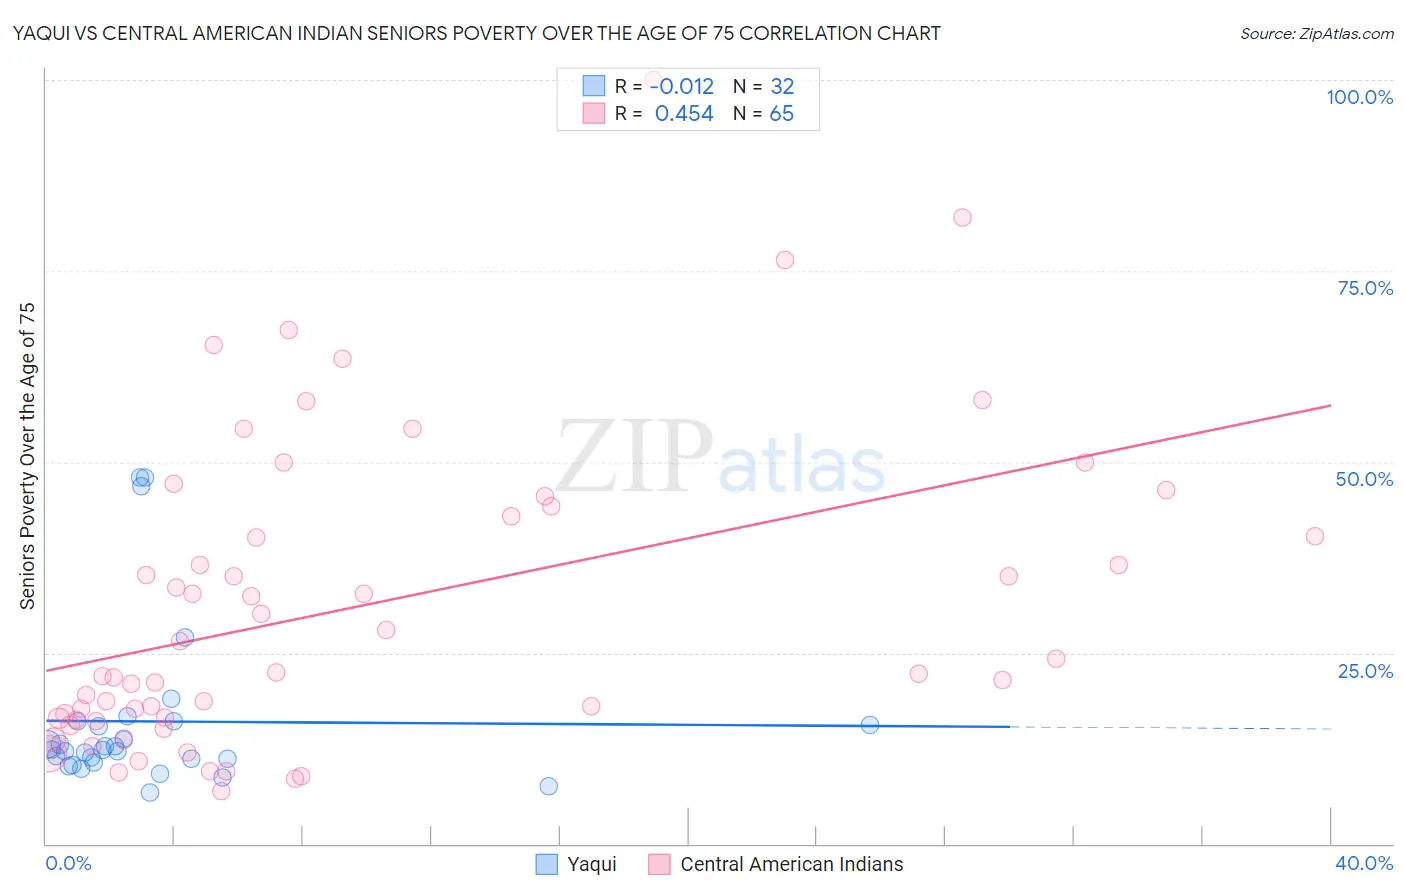
Yaqui vs Central American Indian Seniors Poverty Over the Age of 75 Correlation Chart
The statistical analysis conducted on geographies consisting of 107,262,070 people shows no correlation between the proportion of Yaqui and poverty level among seniors over the age of 75 in the United States with a correlation coefficient (R) of -0.012 and weighted average of 12.5%. Similarly, the statistical analysis conducted on geographies consisting of 323,772,656 people shows a moderate positive correlation between the proportion of Central American Indians and poverty level among seniors over the age of 75 in the United States with a correlation coefficient (R) of 0.454 and weighted average of 16.5%, a difference of 32.9%.
Seniors Poverty Over the Age of 75 Correlation Summary
| Measurement | Yaqui | Central American Indian |
| Minimum | 6.8% | 6.9% |
| Maximum | 48.0% | 100.0% |
| Range | 41.2% | 93.1% |
| Mean | 16.0% | 31.1% |
| Median | 12.3% | 22.4% |
| Interquartile 25% (IQ1) | 10.9% | 16.4% |
| Interquartile 75% (IQ3) | 15.8% | 43.5% |
| Interquartile Range (IQR) | 4.9% | 27.1% |
| Standard Deviation (Sample) | 11.0% | 20.1% |
| Standard Deviation (Population) | 10.8% | 20.0% |
Similar Demographics by Seniors Poverty Over the Age of 75
Demographics Similar to Yaqui by Seniors Poverty Over the Age of 75
In terms of seniors poverty over the age of 75, the demographic groups most similar to Yaqui are Immigrants from Northern Africa (12.5%, a difference of 0.070%), Immigrants from Indonesia (12.5%, a difference of 0.15%), Immigrants from Congo (12.5%, a difference of 0.21%), Liberian (12.5%, a difference of 0.29%), and Sri Lankan (12.4%, a difference of 0.63%).
| Demographics | Rating | Rank | Seniors Poverty Over the Age of 75 |
| Immigrants | South Eastern Asia | 44.3 /100 | #180 | Average 12.2% |
| Immigrants | Australia | 44.2 /100 | #181 | Average 12.2% |
| German Russians | 41.4 /100 | #182 | Average 12.3% |
| Laotians | 38.2 /100 | #183 | Fair 12.3% |
| Kiowa | 36.0 /100 | #184 | Fair 12.3% |
| Immigrants | Malaysia | 35.8 /100 | #185 | Fair 12.3% |
| Sri Lankans | 32.3 /100 | #186 | Fair 12.4% |
| Yaqui | 25.9 /100 | #187 | Fair 12.5% |
| Immigrants | Northern Africa | 25.2 /100 | #188 | Fair 12.5% |
| Immigrants | Indonesia | 24.4 /100 | #189 | Fair 12.5% |
| Immigrants | Congo | 23.9 /100 | #190 | Fair 12.5% |
| Liberians | 23.2 /100 | #191 | Fair 12.5% |
| Choctaw | 20.2 /100 | #192 | Fair 12.5% |
| Taiwanese | 17.8 /100 | #193 | Poor 12.6% |
| Alsatians | 17.7 /100 | #194 | Poor 12.6% |
Demographics Similar to Central American Indians by Seniors Poverty Over the Age of 75
In terms of seniors poverty over the age of 75, the demographic groups most similar to Central American Indians are Immigrants from Uzbekistan (16.5%, a difference of 0.050%), Immigrants from Barbados (16.5%, a difference of 0.090%), Immigrants from Haiti (16.5%, a difference of 0.11%), Immigrants from Yemen (16.5%, a difference of 0.30%), and Nicaraguan (16.6%, a difference of 0.43%).
| Demographics | Rating | Rank | Seniors Poverty Over the Age of 75 |
| Immigrants | Ecuador | 0.0 /100 | #316 | Tragic 16.1% |
| Immigrants | Guyana | 0.0 /100 | #317 | Tragic 16.2% |
| Houma | 0.0 /100 | #318 | Tragic 16.2% |
| Haitians | 0.0 /100 | #319 | Tragic 16.2% |
| Immigrants | Yemen | 0.0 /100 | #320 | Tragic 16.5% |
| Immigrants | Haiti | 0.0 /100 | #321 | Tragic 16.5% |
| Immigrants | Barbados | 0.0 /100 | #322 | Tragic 16.5% |
| Central American Indians | 0.0 /100 | #323 | Tragic 16.5% |
| Immigrants | Uzbekistan | 0.0 /100 | #324 | Tragic 16.5% |
| Nicaraguans | 0.0 /100 | #325 | Tragic 16.6% |
| Pueblo | 0.0 /100 | #326 | Tragic 16.7% |
| Sioux | 0.0 /100 | #327 | Tragic 16.8% |
| Cape Verdeans | 0.0 /100 | #328 | Tragic 16.8% |
| Immigrants | Dominica | 0.0 /100 | #329 | Tragic 17.0% |
| British West Indians | 0.0 /100 | #330 | Tragic 17.4% |