Delaware vs Maltese Child Poverty Under the Age of 16

COMPARE

Delaware
Race
Ancestry
AfghanAfricanAlaska NativeAlaskan AthabascanAlbanianAleutAlsatianAmericanApacheArabArapahoArgentineanArmenianAssyrian/Chaldean/SyriacAustralianAustrianBahamianBangladeshiBarbadianBasqueBelgianBelizeanBermudanBhutaneseBlackfeetBolivianBrazilianBritishBritish West IndianBulgarianBurmeseCajunCambodianCanadianCape VerdeanCarpatho RusynCelticCentral AmericanCentral American IndianCherokeeCheyenneChickasawChileanChineseChippewaChoctawColombianColvilleComancheCosta RicanCreeCreekCroatianCrowCubanCypriotCzechCzechoslovakianDanishDelawareDominicanDutchDutch West IndianEastern EuropeanEcuadorianEgyptianEnglishEstonianEthiopianEuropeanFijianFilipinoFinnishFrenchFrench American IndianFrench CanadianGermanGerman RussianGhanaianGreekGuamanian/ChamorroGuatemalanGuyaneseHaitianHmongHonduranHopiHoumaHungarianIcelanderIndian (Asian)IndonesianInupiatIranianIraqiIrishIroquoisIsraeliItalianJamaicanJapaneseJordanianKenyanKiowaKoreanLaotianLatvianLebaneseLiberianLithuanianLumbeeLuxembourgerMacedonianMalaysianMarshalleseMenomineeMexicanMexican American IndianMongolianMoroccanNative HawaiianNavajoNepaleseNew ZealanderNicaraguanNigerianNorthern EuropeanNorwegianOkinawanOsageOttawaPaiutePakistaniPalestinianPanamanianParaguayanPennsylvania GermanPeruvianPimaPolishPortuguesePotawatomiPuebloPuerto RicanPuget Sound SalishRomanianRussianSalvadoranSamoanScandinavianScotch-IrishScottishSeminoleSenegaleseSerbianShoshoneSierra LeoneanSiouxSlavicSlovakSloveneSomaliSouth AfricanSouth AmericanSouth American IndianSoviet UnionSpaniardSpanishSpanish AmericanSpanish American IndianSri LankanSubsaharan AfricanSudaneseSwedishSwissSyrianTaiwaneseThaiTlingit-HaidaTohono O'OdhamTonganTrinidadian and TobagonianTsimshianTurkishU.S. Virgin IslanderUgandanUkrainianUruguayanUteVenezuelanVietnameseWelshWest IndianYakamaYaquiYugoslavianYumanYup'ikZimbabwean
Immigration
NonimmigrantsImmigrantsAfghanistanAfricaAlbaniaArgentinaArmeniaAsiaAustraliaAustriaBahamasBangladeshBarbadosBelarusBelgiumBelizeBoliviaBosnia and HerzegovinaBrazilBulgariaBurma/MyanmarCabo VerdeCambodiaCameroonCanadaCaribbeanCentral AmericaChileChinaColombiaCongoCosta RicaCroatiaCubaCzechoslovakiaDenmarkDominicaDominican RepublicEastern AfricaEastern AsiaEastern EuropeEcuadorEgyptEl SalvadorEnglandEritreaEthiopiaEuropeFijiFranceGermanyGhanaGreeceGrenadaGuatemalaGuyanaHaitiHondurasHong KongHungaryIndiaIndonesiaIranIraqIrelandIsraelItalyJamaicaJapanJordanKazakhstanKenyaKoreaKuwaitLaosLatin AmericaLatviaLebanonLiberiaLithuaniaMalaysiaMexicoMicronesiaMiddle AfricaMoldovaMoroccoNepalNetherlandsNicaraguaNigeriaNorth AmericaNorth MacedoniaNorthern AfricaNorthern EuropeNorwayOceaniaPakistanPanamaPeruPhilippinesPolandPortugalRomaniaRussiaSaudi ArabiaScotlandSenegalSerbiaSierra LeoneSingaporeSomaliaSouth AfricaSouth AmericaSouth Central AsiaSouth Eastern AsiaSouthern EuropeSpainSri LankaSt. Vincent and the GrenadinesSudanSwedenSwitzerlandSyriaTaiwanThailandTrinidad and TobagoTurkeyUgandaUkraineUruguayUzbekistanVenezuelaVietnamWest IndiesWestern AfricaWestern AsiaWestern EuropeYemenZaireZimbabweAzores
Maltese
Race
Ancestry
AfghanAfricanAlaska NativeAlaskan AthabascanAlbanianAleutAlsatianAmericanApacheArabArapahoArgentineanArmenianAssyrian/Chaldean/SyriacAustralianAustrianBahamianBangladeshiBarbadianBasqueBelgianBelizeanBermudanBhutaneseBlackfeetBolivianBrazilianBritishBritish West IndianBulgarianBurmeseCajunCambodianCanadianCape VerdeanCarpatho RusynCelticCentral AmericanCentral American IndianCherokeeCheyenneChickasawChileanChineseChippewaChoctawColombianColvilleComancheCosta RicanCreeCreekCroatianCrowCubanCypriotCzechCzechoslovakianDanishDominicanDutchDutch West IndianEastern EuropeanEcuadorianEgyptianEnglishEstonianEthiopianEuropeanFijianFilipinoFinnishFrenchFrench American IndianFrench CanadianGermanGerman RussianGhanaianGreekGuamanian/ChamorroGuatemalanGuyaneseHaitianHmongHonduranHopiHoumaHungarianIcelanderIndian (Asian)IndonesianInupiatIranianIraqiIrishIroquoisIsraeliItalianJamaicanJapaneseJordanianKenyanKiowaKoreanLaotianLatvianLebaneseLiberianLithuanianLumbeeLuxembourgerMacedonianMalaysianMalteseMarshalleseMenomineeMexicanMexican American IndianMongolianMoroccanNative HawaiianNavajoNepaleseNew ZealanderNicaraguanNigerianNorthern EuropeanNorwegianOkinawanOsageOttawaPaiutePakistaniPalestinianPanamanianParaguayanPennsylvania GermanPeruvianPimaPolishPortuguesePotawatomiPuebloPuerto RicanPuget Sound SalishRomanianRussianSalvadoranSamoanScandinavianScotch-IrishScottishSeminoleSenegaleseSerbianShoshoneSierra LeoneanSiouxSlavicSlovakSloveneSomaliSouth AfricanSouth AmericanSouth American IndianSoviet UnionSpaniardSpanishSpanish AmericanSpanish American IndianSri LankanSubsaharan AfricanSudaneseSwedishSwissSyrianTaiwaneseThaiTlingit-HaidaTohono O'OdhamTonganTrinidadian and TobagonianTsimshianTurkishU.S. Virgin IslanderUgandanUkrainianUruguayanUteVenezuelanVietnameseWelshWest IndianYakamaYaquiYugoslavianYumanYup'ikZimbabwean
Immigration
NonimmigrantsImmigrantsAfghanistanAfricaAlbaniaArgentinaArmeniaAsiaAustraliaAustriaBahamasBangladeshBarbadosBelarusBelgiumBelizeBoliviaBosnia and HerzegovinaBrazilBulgariaBurma/MyanmarCabo VerdeCambodiaCameroonCanadaCaribbeanCentral AmericaChileChinaColombiaCongoCosta RicaCroatiaCubaCzechoslovakiaDenmarkDominicaDominican RepublicEastern AfricaEastern AsiaEastern EuropeEcuadorEgyptEl SalvadorEnglandEritreaEthiopiaEuropeFijiFranceGermanyGhanaGreeceGrenadaGuatemalaGuyanaHaitiHondurasHong KongHungaryIndiaIndonesiaIranIraqIrelandIsraelItalyJamaicaJapanJordanKazakhstanKenyaKoreaKuwaitLaosLatin AmericaLatviaLebanonLiberiaLithuaniaMalaysiaMexicoMicronesiaMiddle AfricaMoldovaMoroccoNepalNetherlandsNicaraguaNigeriaNorth AmericaNorth MacedoniaNorthern AfricaNorthern EuropeNorwayOceaniaPakistanPanamaPeruPhilippinesPolandPortugalRomaniaRussiaSaudi ArabiaScotlandSenegalSerbiaSierra LeoneSingaporeSomaliaSouth AfricaSouth AmericaSouth Central AsiaSouth Eastern AsiaSouthern EuropeSpainSri LankaSt. Vincent and the GrenadinesSudanSwedenSwitzerlandSyriaTaiwanThailandTrinidad and TobagoTurkeyUgandaUkraineUruguayUzbekistanVenezuelaVietnamWest IndiesWestern AfricaWestern AsiaWestern EuropeYemenZaireZimbabweAzores
Child Poverty Under the Age of 16
Income
Poverty
Unemployment
Labor Participation
Family Structure
Vehicle Availability
Education Level
Disability

Child Poverty Under the Age of 16 Comparison

Delaware

Maltese

Poor
Exceptional
17.0%
CHILD POVERTY UNDER THE AGE OF 16
17.1/ 100
METRIC RATING
198th/ 347
METRIC RANK
13.1%
CHILD POVERTY UNDER THE AGE OF 16
99.8/ 100
METRIC RATING
22nd/ 347
METRIC RANK

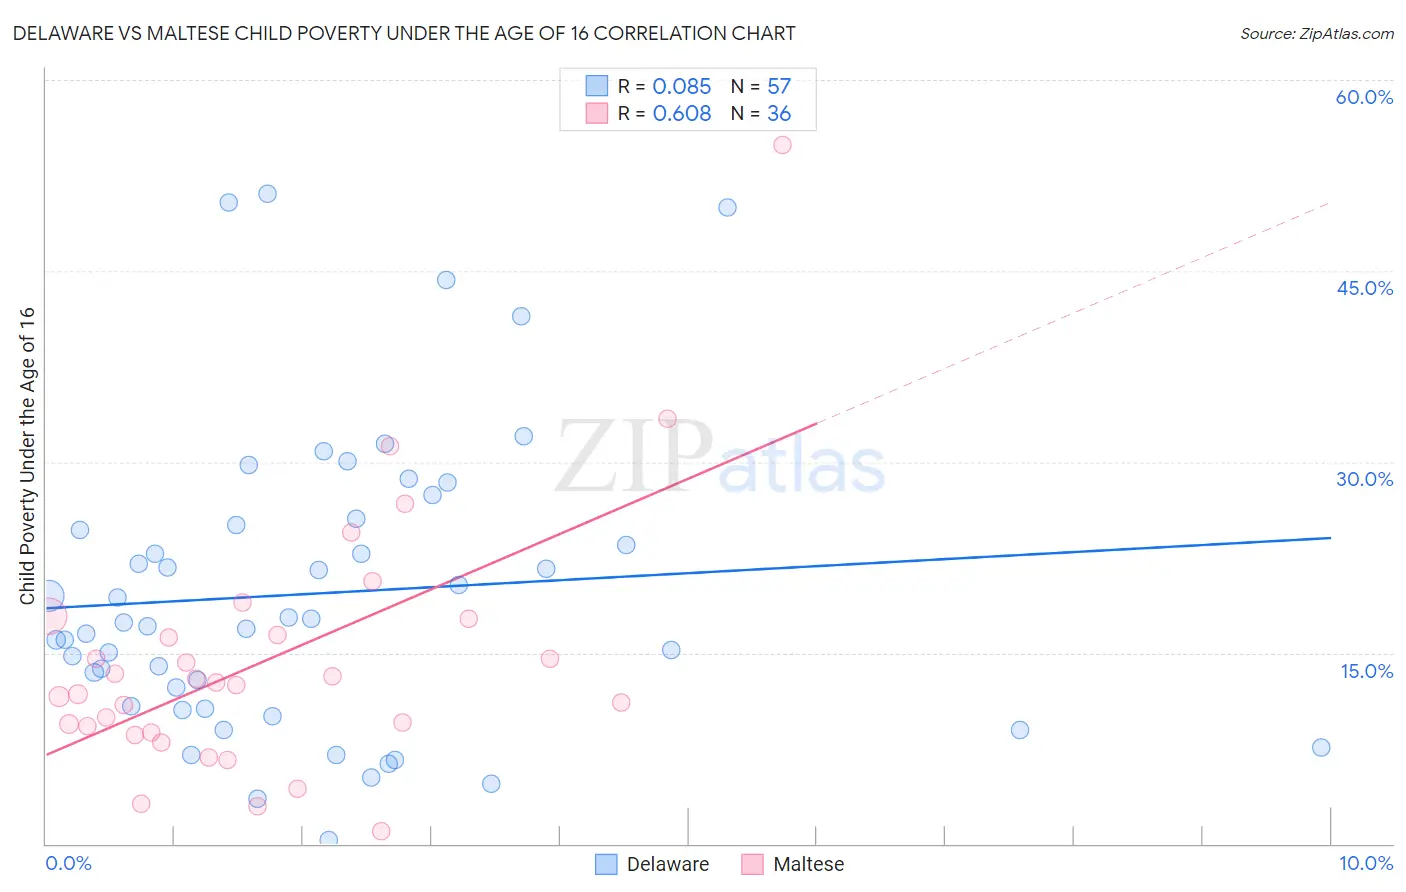
Delaware vs Maltese Child Poverty Under the Age of 16 Correlation Chart

The statistical analysis conducted on geographies consisting of 95,926,108 people shows a slight positive correlation between the proportion of Delaware and poverty level among children under the age of 16 in the United States with a correlation coefficient (R) of 0.085 and weighted average of 17.0%. Similarly, the statistical analysis conducted on geographies consisting of 125,710,734 people shows a significant positive correlation between the proportion of Maltese and poverty level among children under the age of 16 in the United States with a correlation coefficient (R) of 0.608 and weighted average of 13.1%, a difference of 29.2%.
Delaware vs Maltese Child Poverty Under the Age of 16

Child Poverty Under the Age of 16 Correlation Summary

MeasurementDelawareMaltese
Minimum0.33%0.98%
Maximum51.0%54.9%
Range50.7%53.9%
Mean19.7%14.4%
Median17.4%12.6%
Interquartile 25% (IQ1)10.7%9.0%
Interquartile 75% (IQ3)25.3%17.0%
Interquartile Range (IQR)14.6%8.0%
Standard Deviation (Sample)11.7%10.1%
Standard Deviation (Population)11.6%9.9%

Similar Demographics by Child Poverty Under the Age of 16

Demographics Similar to Delaware by Child Poverty Under the Age of 16

In terms of child poverty under the age of 16, the demographic groups most similar to Delaware are Immigrants from Kenya (16.9%, a difference of 0.40%), Immigrants from Afghanistan (17.0%, a difference of 0.41%), Immigrants from Cameroon (17.1%, a difference of 0.51%), Immigrants from Uzbekistan (17.1%, a difference of 0.52%), and Ugandan (17.1%, a difference of 0.60%).
DemographicsRating | RankChild Poverty Under the Age of 16
Immigrants | Iraq
28.3
/100
|
#191
Fair
16.7%
Spanish
24.5
/100
|
#192
Fair
16.7%
Spaniards
23.2
/100
|
#193
Fair
16.8%
Immigrants | Uruguay
23.1
/100
|
#194
Fair
16.8%
Immigrants | Uganda
22.5
/100
|
#195
Fair
16.8%
Immigrants | Lebanon
22.0
/100
|
#196
Fair
16.8%
Immigrants | Kenya
19.1
/100
|
#197
Poor
16.9%
Delaware
17.1
/100
|
#198
Poor
17.0%
Immigrants | Afghanistan
15.1
/100
|
#199
Poor
17.0%
Immigrants | Cameroon
14.7
/100
|
#200
Poor
17.1%
Immigrants | Uzbekistan
14.7
/100
|
#201
Poor
17.1%
Ugandans
14.3
/100
|
#202
Poor
17.1%
Immigrants | Sierra Leone
14.2
/100
|
#203
Poor
17.1%
Hmong
14.0
/100
|
#204
Poor
17.1%
Aleuts
13.9
/100
|
#205
Poor
17.1%

Demographics Similar to Maltese by Child Poverty Under the Age of 16

In terms of child poverty under the age of 16, the demographic groups most similar to Maltese are Indian (Asian) (13.1%, a difference of 0.040%), Immigrants from Eastern Asia (13.1%, a difference of 0.080%), Okinawan (13.1%, a difference of 0.11%), Latvian (13.2%, a difference of 0.25%), and Eastern European (13.2%, a difference of 0.33%).
DemographicsRating | RankChild Poverty Under the Age of 16
Immigrants | Korea
99.9
/100
|
#15
Exceptional
13.0%
Norwegians
99.9
/100
|
#16
Exceptional
13.0%
Bulgarians
99.9
/100
|
#17
Exceptional
13.0%
Cypriots
99.9
/100
|
#18
Exceptional
13.0%
Immigrants | Japan
99.8
/100
|
#19
Exceptional
13.0%
Okinawans
99.8
/100
|
#20
Exceptional
13.1%
Immigrants | Eastern Asia
99.8
/100
|
#21
Exceptional
13.1%
Maltese
99.8
/100
|
#22
Exceptional
13.1%
Indians (Asian)
99.8
/100
|
#23
Exceptional
13.1%
Latvians
99.8
/100
|
#24
Exceptional
13.2%
Eastern Europeans
99.8
/100
|
#25
Exceptional
13.2%
Bolivians
99.8
/100
|
#26
Exceptional
13.2%
Immigrants | China
99.8
/100
|
#27
Exceptional
13.3%
Assyrians/Chaldeans/Syriacs
99.7
/100
|
#28
Exceptional
13.3%
Swedes
99.7
/100
|
#29
Exceptional
13.3%