Delaware vs Immigrants from Spain Child Poverty Under the Age of 16
COMPARE
Delaware
Immigrants from Spain
Child Poverty Under the Age of 16
Child Poverty Under the Age of 16 Comparison
Delaware
Immigrants from Spain
17.0%
CHILD POVERTY UNDER THE AGE OF 16
17.1/ 100
METRIC RATING
198th/ 347
METRIC RANK
15.3%
CHILD POVERTY UNDER THE AGE OF 16
87.3/ 100
METRIC RATING
136th/ 347
METRIC RANK
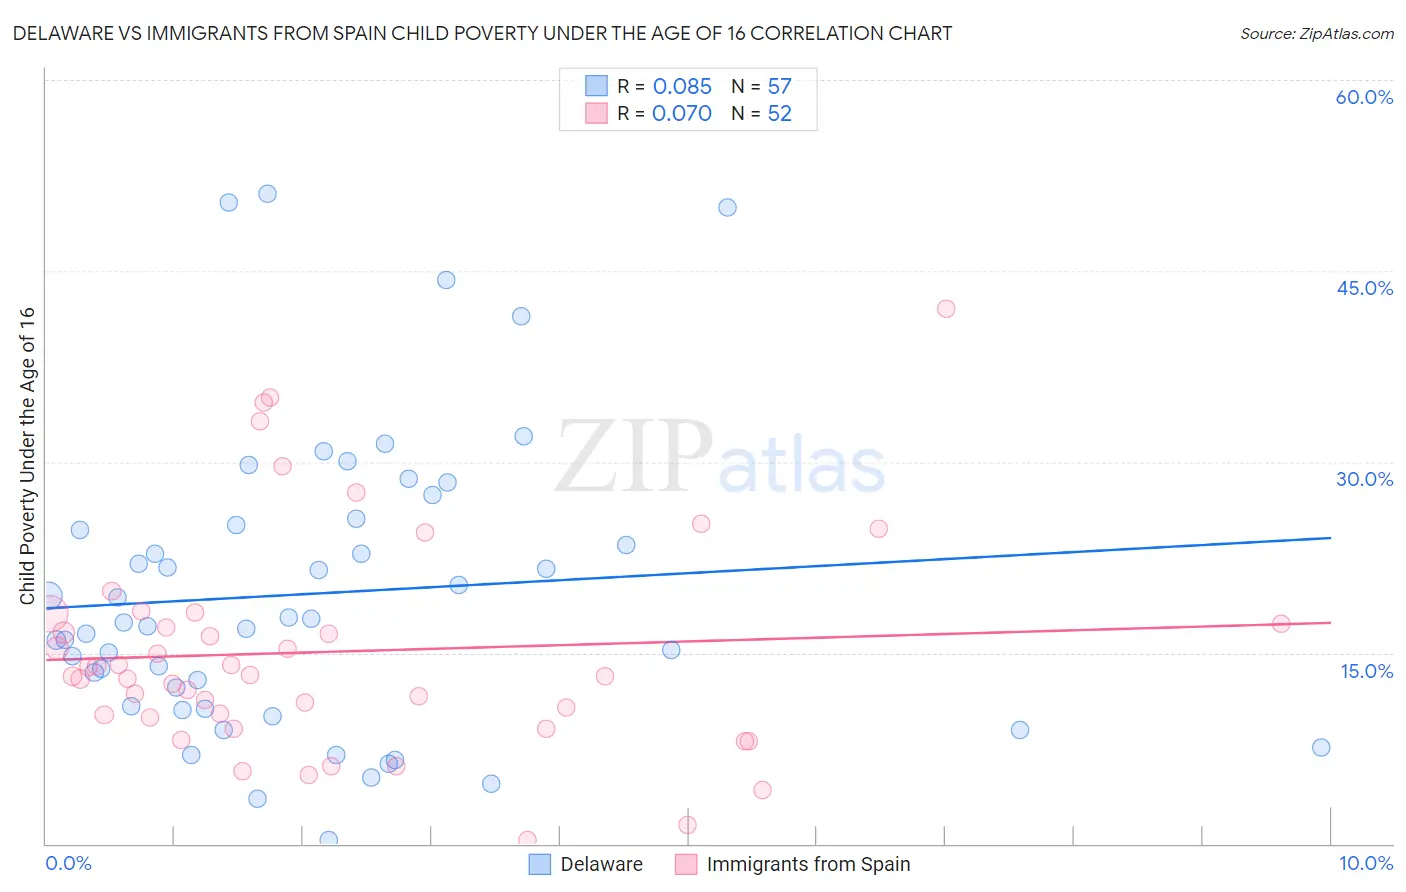
Delaware vs Immigrants from Spain Child Poverty Under the Age of 16 Correlation Chart
The statistical analysis conducted on geographies consisting of 95,926,108 people shows a slight positive correlation between the proportion of Delaware and poverty level among children under the age of 16 in the United States with a correlation coefficient (R) of 0.085 and weighted average of 17.0%. Similarly, the statistical analysis conducted on geographies consisting of 238,138,413 people shows a slight positive correlation between the proportion of Immigrants from Spain and poverty level among children under the age of 16 in the United States with a correlation coefficient (R) of 0.070 and weighted average of 15.3%, a difference of 11.2%.
Child Poverty Under the Age of 16 Correlation Summary
| Measurement | Delaware | Immigrants from Spain |
| Minimum | 0.33% | 0.32% |
| Maximum | 51.0% | 42.0% |
| Range | 50.7% | 41.7% |
| Mean | 19.7% | 15.1% |
| Median | 17.4% | 13.2% |
| Interquartile 25% (IQ1) | 10.7% | 10.0% |
| Interquartile 75% (IQ3) | 25.3% | 17.7% |
| Interquartile Range (IQR) | 14.6% | 7.7% |
| Standard Deviation (Sample) | 11.7% | 8.7% |
| Standard Deviation (Population) | 11.6% | 8.6% |
Similar Demographics by Child Poverty Under the Age of 16
Demographics Similar to Delaware by Child Poverty Under the Age of 16
In terms of child poverty under the age of 16, the demographic groups most similar to Delaware are Immigrants from Kenya (16.9%, a difference of 0.40%), Immigrants from Afghanistan (17.0%, a difference of 0.41%), Immigrants from Cameroon (17.1%, a difference of 0.51%), Immigrants from Uzbekistan (17.1%, a difference of 0.52%), and Ugandan (17.1%, a difference of 0.60%).
| Demographics | Rating | Rank | Child Poverty Under the Age of 16 |
| Immigrants | Iraq | 28.3 /100 | #191 | Fair 16.7% |
| Spanish | 24.5 /100 | #192 | Fair 16.7% |
| Spaniards | 23.2 /100 | #193 | Fair 16.8% |
| Immigrants | Uruguay | 23.1 /100 | #194 | Fair 16.8% |
| Immigrants | Uganda | 22.5 /100 | #195 | Fair 16.8% |
| Immigrants | Lebanon | 22.0 /100 | #196 | Fair 16.8% |
| Immigrants | Kenya | 19.1 /100 | #197 | Poor 16.9% |
| Delaware | 17.1 /100 | #198 | Poor 17.0% |
| Immigrants | Afghanistan | 15.1 /100 | #199 | Poor 17.0% |
| Immigrants | Cameroon | 14.7 /100 | #200 | Poor 17.1% |
| Immigrants | Uzbekistan | 14.7 /100 | #201 | Poor 17.1% |
| Ugandans | 14.3 /100 | #202 | Poor 17.1% |
| Immigrants | Sierra Leone | 14.2 /100 | #203 | Poor 17.1% |
| Hmong | 14.0 /100 | #204 | Poor 17.1% |
| Aleuts | 13.9 /100 | #205 | Poor 17.1% |
Demographics Similar to Immigrants from Spain by Child Poverty Under the Age of 16
In terms of child poverty under the age of 16, the demographic groups most similar to Immigrants from Spain are Peruvian (15.3%, a difference of 0.030%), Welsh (15.3%, a difference of 0.040%), Immigrants from Vietnam (15.3%, a difference of 0.080%), New Zealander (15.3%, a difference of 0.14%), and Albanian (15.2%, a difference of 0.37%).
| Demographics | Rating | Rank | Child Poverty Under the Age of 16 |
| Immigrants | Southern Europe | 89.7 /100 | #129 | Excellent 15.1% |
| Mongolians | 89.5 /100 | #130 | Excellent 15.2% |
| Armenians | 89.4 /100 | #131 | Excellent 15.2% |
| Canadians | 89.1 /100 | #132 | Excellent 15.2% |
| Immigrants | South Eastern Asia | 89.0 /100 | #133 | Excellent 15.2% |
| Native Hawaiians | 88.7 /100 | #134 | Excellent 15.2% |
| Albanians | 88.6 /100 | #135 | Excellent 15.2% |
| Immigrants | Spain | 87.3 /100 | #136 | Excellent 15.3% |
| Peruvians | 87.2 /100 | #137 | Excellent 15.3% |
| Welsh | 87.2 /100 | #138 | Excellent 15.3% |
| Immigrants | Vietnam | 87.1 /100 | #139 | Excellent 15.3% |
| New Zealanders | 86.9 /100 | #140 | Excellent 15.3% |
| Slavs | 84.2 /100 | #141 | Excellent 15.4% |
| Brazilians | 82.8 /100 | #142 | Excellent 15.4% |
| Icelanders | 82.5 /100 | #143 | Excellent 15.4% |