Delaware vs Maltese Child Poverty Among Boys Under 16
COMPARE
Delaware
Maltese
Child Poverty Among Boys Under 16
Child Poverty Among Boys Under 16 Comparison
Delaware
Maltese
17.1%
CHILD POVERTY AMONG BOYS UNDER 16
18.8/ 100
METRIC RATING
199th/ 347
METRIC RANK
13.2%
CHILD POVERTY AMONG BOYS UNDER 16
99.9/ 100
METRIC RATING
16th/ 347
METRIC RANK
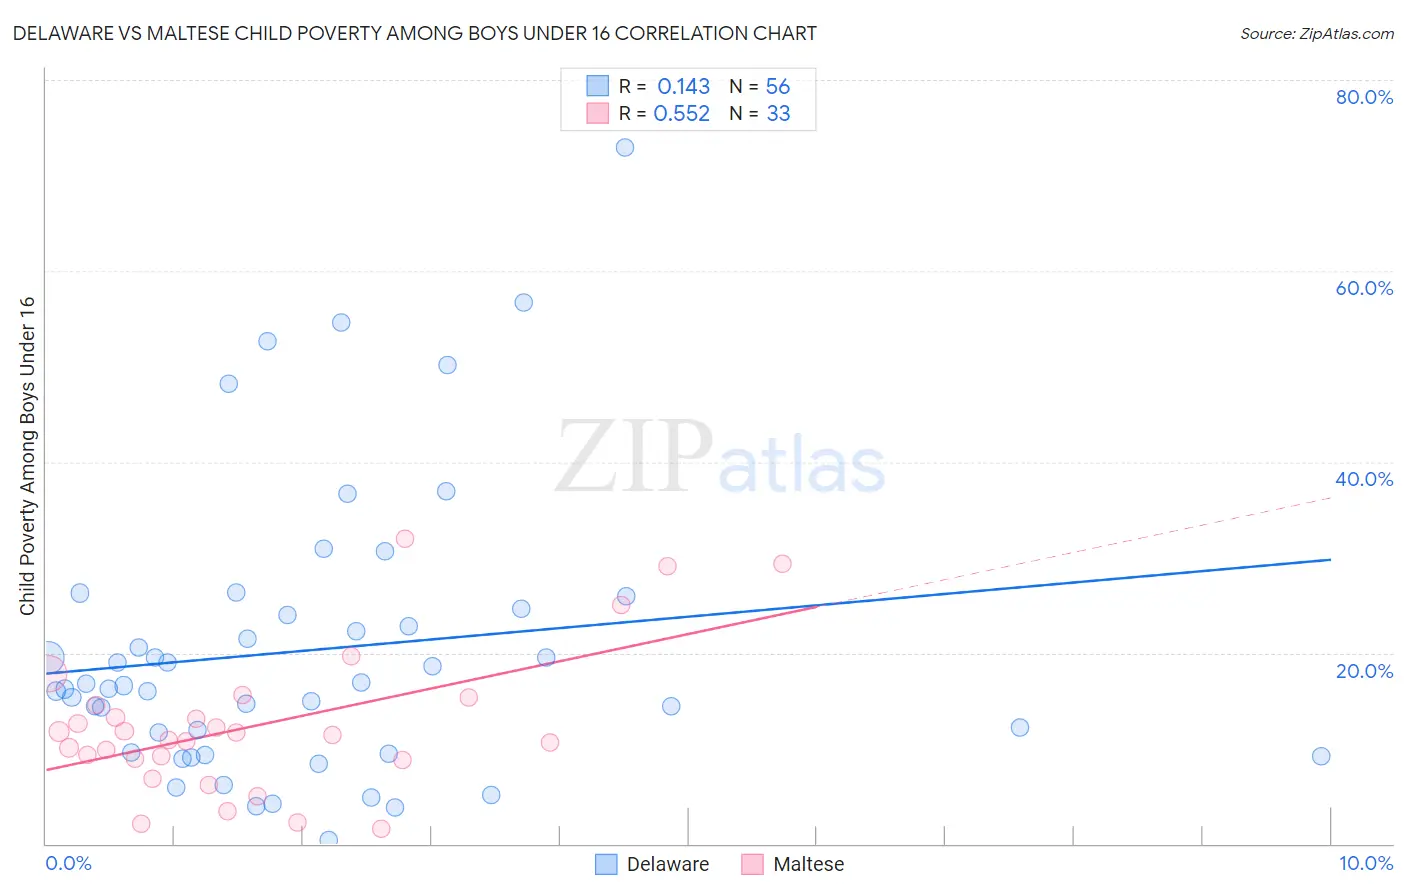
Delaware vs Maltese Child Poverty Among Boys Under 16 Correlation Chart
The statistical analysis conducted on geographies consisting of 95,638,323 people shows a poor positive correlation between the proportion of Delaware and poverty level among boys under the age of 16 in the United States with a correlation coefficient (R) of 0.143 and weighted average of 17.1%. Similarly, the statistical analysis conducted on geographies consisting of 125,189,723 people shows a substantial positive correlation between the proportion of Maltese and poverty level among boys under the age of 16 in the United States with a correlation coefficient (R) of 0.552 and weighted average of 13.2%, a difference of 29.8%.
Child Poverty Among Boys Under 16 Correlation Summary
| Measurement | Delaware | Maltese |
| Minimum | 0.35% | 1.6% |
| Maximum | 73.0% | 31.9% |
| Range | 72.6% | 30.3% |
| Mean | 20.3% | 12.5% |
| Median | 16.4% | 11.4% |
| Interquartile 25% (IQ1) | 9.5% | 8.8% |
| Interquartile 75% (IQ3) | 24.3% | 15.0% |
| Interquartile Range (IQR) | 14.8% | 6.2% |
| Standard Deviation (Sample) | 15.0% | 7.5% |
| Standard Deviation (Population) | 14.9% | 7.4% |
Similar Demographics by Child Poverty Among Boys Under 16
Demographics Similar to Delaware by Child Poverty Among Boys Under 16
In terms of child poverty among boys under 16, the demographic groups most similar to Delaware are Immigrants from Cameroon (17.1%, a difference of 0.040%), Immigrants from Kenya (17.1%, a difference of 0.23%), Spaniard (17.1%, a difference of 0.30%), Immigrants from Uruguay (17.2%, a difference of 0.33%), and Spanish (17.0%, a difference of 0.34%).
| Demographics | Rating | Rank | Child Poverty Among Boys Under 16 |
| Immigrants | Uganda | 21.6 /100 | #192 | Fair 17.0% |
| Immigrants | Iraq | 21.6 /100 | #193 | Fair 17.0% |
| Immigrants | Lebanon | 21.2 /100 | #194 | Fair 17.0% |
| Spanish | 20.8 /100 | #195 | Fair 17.0% |
| Spaniards | 20.5 /100 | #196 | Fair 17.1% |
| Immigrants | Kenya | 20.1 /100 | #197 | Fair 17.1% |
| Immigrants | Cameroon | 19.0 /100 | #198 | Poor 17.1% |
| Delaware | 18.8 /100 | #199 | Poor 17.1% |
| Immigrants | Uruguay | 16.9 /100 | #200 | Poor 17.2% |
| Immigrants | Afghanistan | 13.7 /100 | #201 | Poor 17.3% |
| Immigrants | Sierra Leone | 13.4 /100 | #202 | Poor 17.3% |
| Immigrants | Uzbekistan | 13.3 /100 | #203 | Poor 17.3% |
| Ugandans | 12.5 /100 | #204 | Poor 17.3% |
| Immigrants | Portugal | 11.2 /100 | #205 | Poor 17.4% |
| German Russians | 10.9 /100 | #206 | Poor 17.4% |
Demographics Similar to Maltese by Child Poverty Among Boys Under 16
In terms of child poverty among boys under 16, the demographic groups most similar to Maltese are Norwegian (13.2%, a difference of 0.090%), Immigrants from Japan (13.1%, a difference of 0.32%), Immigrants from Ireland (13.1%, a difference of 0.42%), Bulgarian (13.3%, a difference of 0.62%), and Bolivian (13.3%, a difference of 0.68%).
| Demographics | Rating | Rank | Child Poverty Among Boys Under 16 |
| Immigrants | Iran | 100.0 /100 | #9 | Exceptional 12.5% |
| Bhutanese | 100.0 /100 | #10 | Exceptional 12.6% |
| Immigrants | South Central Asia | 100.0 /100 | #11 | Exceptional 12.7% |
| Burmese | 99.9 /100 | #12 | Exceptional 13.0% |
| Immigrants | Korea | 99.9 /100 | #13 | Exceptional 13.0% |
| Immigrants | Ireland | 99.9 /100 | #14 | Exceptional 13.1% |
| Immigrants | Japan | 99.9 /100 | #15 | Exceptional 13.1% |
| Maltese | 99.9 /100 | #16 | Exceptional 13.2% |
| Norwegians | 99.9 /100 | #17 | Exceptional 13.2% |
| Bulgarians | 99.9 /100 | #18 | Exceptional 13.3% |
| Bolivians | 99.9 /100 | #19 | Exceptional 13.3% |
| Indians (Asian) | 99.9 /100 | #20 | Exceptional 13.3% |
| Immigrants | Eastern Asia | 99.9 /100 | #21 | Exceptional 13.3% |
| Tongans | 99.9 /100 | #22 | Exceptional 13.4% |
| Latvians | 99.9 /100 | #23 | Exceptional 13.4% |