Thai vs Maltese Child Poverty Under the Age of 16

COMPARE

Thai
Race
Ancestry
AfghanAfricanAlaska NativeAlaskan AthabascanAlbanianAleutAlsatianAmericanApacheArabArapahoArgentineanArmenianAssyrian/Chaldean/SyriacAustralianAustrianBahamianBangladeshiBarbadianBasqueBelgianBelizeanBermudanBhutaneseBlackfeetBolivianBrazilianBritishBritish West IndianBulgarianBurmeseCajunCambodianCanadianCape VerdeanCarpatho RusynCelticCentral AmericanCentral American IndianCherokeeCheyenneChickasawChileanChineseChippewaChoctawColombianColvilleComancheCosta RicanCreeCreekCroatianCrowCubanCypriotCzechCzechoslovakianDanishDelawareDominicanDutchDutch West IndianEastern EuropeanEcuadorianEgyptianEnglishEstonianEthiopianEuropeanFijianFilipinoFinnishFrenchFrench American IndianFrench CanadianGermanGerman RussianGhanaianGreekGuamanian/ChamorroGuatemalanGuyaneseHaitianHmongHonduranHopiHoumaHungarianIcelanderIndian (Asian)IndonesianInupiatIranianIraqiIrishIroquoisIsraeliItalianJamaicanJapaneseJordanianKenyanKiowaKoreanLaotianLatvianLebaneseLiberianLithuanianLumbeeLuxembourgerMacedonianMalaysianMarshalleseMenomineeMexicanMexican American IndianMongolianMoroccanNative HawaiianNavajoNepaleseNew ZealanderNicaraguanNigerianNorthern EuropeanNorwegianOkinawanOsageOttawaPaiutePakistaniPalestinianPanamanianParaguayanPennsylvania GermanPeruvianPimaPolishPortuguesePotawatomiPuebloPuerto RicanPuget Sound SalishRomanianRussianSalvadoranSamoanScandinavianScotch-IrishScottishSeminoleSenegaleseSerbianShoshoneSierra LeoneanSiouxSlavicSlovakSloveneSomaliSouth AfricanSouth AmericanSouth American IndianSoviet UnionSpaniardSpanishSpanish AmericanSpanish American IndianSri LankanSubsaharan AfricanSudaneseSwedishSwissSyrianTaiwaneseThaiTlingit-HaidaTohono O'OdhamTonganTrinidadian and TobagonianTsimshianTurkishU.S. Virgin IslanderUgandanUkrainianUruguayanUteVenezuelanVietnameseWelshWest IndianYakamaYaquiYugoslavianYumanYup'ikZimbabwean
Immigration
NonimmigrantsImmigrantsAfghanistanAfricaAlbaniaArgentinaArmeniaAsiaAustraliaAustriaBahamasBangladeshBarbadosBelarusBelgiumBelizeBoliviaBosnia and HerzegovinaBrazilBulgariaBurma/MyanmarCabo VerdeCambodiaCameroonCanadaCaribbeanCentral AmericaChileChinaColombiaCongoCosta RicaCroatiaCubaCzechoslovakiaDenmarkDominicaDominican RepublicEastern AfricaEastern AsiaEastern EuropeEcuadorEgyptEl SalvadorEnglandEritreaEthiopiaEuropeFijiFranceGermanyGhanaGreeceGrenadaGuatemalaGuyanaHaitiHondurasHong KongHungaryIndiaIndonesiaIranIraqIrelandIsraelItalyJamaicaJapanJordanKazakhstanKenyaKoreaKuwaitLaosLatin AmericaLatviaLebanonLiberiaLithuaniaMalaysiaMexicoMicronesiaMiddle AfricaMoldovaMoroccoNepalNetherlandsNicaraguaNigeriaNorth AmericaNorth MacedoniaNorthern AfricaNorthern EuropeNorwayOceaniaPakistanPanamaPeruPhilippinesPolandPortugalRomaniaRussiaSaudi ArabiaScotlandSenegalSerbiaSierra LeoneSingaporeSomaliaSouth AfricaSouth AmericaSouth Central AsiaSouth Eastern AsiaSouthern EuropeSpainSri LankaSt. Vincent and the GrenadinesSudanSwedenSwitzerlandSyriaTaiwanThailandTrinidad and TobagoTurkeyUgandaUkraineUruguayUzbekistanVenezuelaVietnamWest IndiesWestern AfricaWestern AsiaWestern EuropeYemenZaireZimbabweAzores
Maltese
Race
Ancestry
AfghanAfricanAlaska NativeAlaskan AthabascanAlbanianAleutAlsatianAmericanApacheArabArapahoArgentineanArmenianAssyrian/Chaldean/SyriacAustralianAustrianBahamianBangladeshiBarbadianBasqueBelgianBelizeanBermudanBhutaneseBlackfeetBolivianBrazilianBritishBritish West IndianBulgarianBurmeseCajunCambodianCanadianCape VerdeanCarpatho RusynCelticCentral AmericanCentral American IndianCherokeeCheyenneChickasawChileanChineseChippewaChoctawColombianColvilleComancheCosta RicanCreeCreekCroatianCrowCubanCypriotCzechCzechoslovakianDanishDelawareDominicanDutchDutch West IndianEastern EuropeanEcuadorianEgyptianEnglishEstonianEthiopianEuropeanFijianFilipinoFinnishFrenchFrench American IndianFrench CanadianGermanGerman RussianGhanaianGreekGuamanian/ChamorroGuatemalanGuyaneseHaitianHmongHonduranHopiHoumaHungarianIcelanderIndian (Asian)IndonesianInupiatIranianIraqiIrishIroquoisIsraeliItalianJamaicanJapaneseJordanianKenyanKiowaKoreanLaotianLatvianLebaneseLiberianLithuanianLumbeeLuxembourgerMacedonianMalaysianMalteseMarshalleseMenomineeMexicanMexican American IndianMongolianMoroccanNative HawaiianNavajoNepaleseNew ZealanderNicaraguanNigerianNorthern EuropeanNorwegianOkinawanOsageOttawaPaiutePakistaniPalestinianPanamanianParaguayanPennsylvania GermanPeruvianPimaPolishPortuguesePotawatomiPuebloPuerto RicanPuget Sound SalishRomanianRussianSalvadoranSamoanScandinavianScotch-IrishScottishSeminoleSenegaleseSerbianShoshoneSierra LeoneanSiouxSlavicSlovakSloveneSomaliSouth AfricanSouth AmericanSouth American IndianSoviet UnionSpaniardSpanishSpanish AmericanSpanish American IndianSri LankanSubsaharan AfricanSudaneseSwedishSwissSyrianTaiwaneseTlingit-HaidaTohono O'OdhamTonganTrinidadian and TobagonianTsimshianTurkishU.S. Virgin IslanderUgandanUkrainianUruguayanUteVenezuelanVietnameseWelshWest IndianYakamaYaquiYugoslavianYumanYup'ikZimbabwean
Immigration
NonimmigrantsImmigrantsAfghanistanAfricaAlbaniaArgentinaArmeniaAsiaAustraliaAustriaBahamasBangladeshBarbadosBelarusBelgiumBelizeBoliviaBosnia and HerzegovinaBrazilBulgariaBurma/MyanmarCabo VerdeCambodiaCameroonCanadaCaribbeanCentral AmericaChileChinaColombiaCongoCosta RicaCroatiaCubaCzechoslovakiaDenmarkDominicaDominican RepublicEastern AfricaEastern AsiaEastern EuropeEcuadorEgyptEl SalvadorEnglandEritreaEthiopiaEuropeFijiFranceGermanyGhanaGreeceGrenadaGuatemalaGuyanaHaitiHondurasHong KongHungaryIndiaIndonesiaIranIraqIrelandIsraelItalyJamaicaJapanJordanKazakhstanKenyaKoreaKuwaitLaosLatin AmericaLatviaLebanonLiberiaLithuaniaMalaysiaMexicoMicronesiaMiddle AfricaMoldovaMoroccoNepalNetherlandsNicaraguaNigeriaNorth AmericaNorth MacedoniaNorthern AfricaNorthern EuropeNorwayOceaniaPakistanPanamaPeruPhilippinesPolandPortugalRomaniaRussiaSaudi ArabiaScotlandSenegalSerbiaSierra LeoneSingaporeSomaliaSouth AfricaSouth AmericaSouth Central AsiaSouth Eastern AsiaSouthern EuropeSpainSri LankaSt. Vincent and the GrenadinesSudanSwedenSwitzerlandSyriaTaiwanThailandTrinidad and TobagoTurkeyUgandaUkraineUruguayUzbekistanVenezuelaVietnamWest IndiesWestern AfricaWestern AsiaWestern EuropeYemenZaireZimbabweAzores
Child Poverty Under the Age of 16
Income
Poverty
Unemployment
Labor Participation
Family Structure
Vehicle Availability
Education Level
Disability

Child Poverty Under the Age of 16 Comparison

Thais

Maltese

Exceptional
Exceptional
11.6%
CHILD POVERTY UNDER THE AGE OF 16
100.0/ 100
METRIC RATING
4th/ 347
METRIC RANK
13.1%
CHILD POVERTY UNDER THE AGE OF 16
99.8/ 100
METRIC RATING
22nd/ 347
METRIC RANK

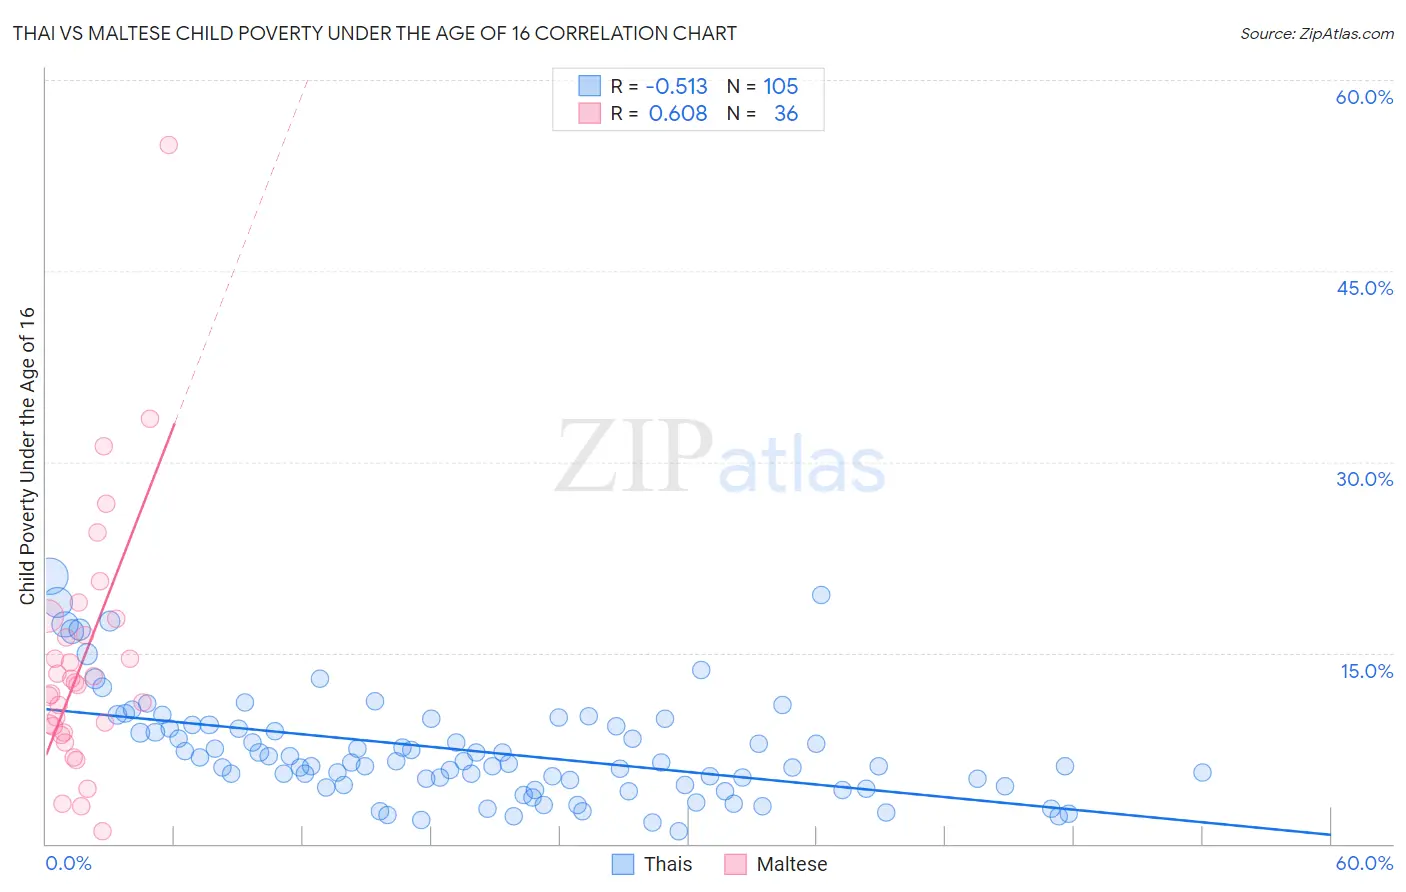
Thai vs Maltese Child Poverty Under the Age of 16 Correlation Chart

The statistical analysis conducted on geographies consisting of 469,747,555 people shows a substantial negative correlation between the proportion of Thais and poverty level among children under the age of 16 in the United States with a correlation coefficient (R) of -0.513 and weighted average of 11.6%. Similarly, the statistical analysis conducted on geographies consisting of 125,710,734 people shows a significant positive correlation between the proportion of Maltese and poverty level among children under the age of 16 in the United States with a correlation coefficient (R) of 0.608 and weighted average of 13.1%, a difference of 13.6%.
Thai vs Maltese Child Poverty Under the Age of 16

Child Poverty Under the Age of 16 Correlation Summary

MeasurementThaiMaltese
Minimum1.0%0.98%
Maximum21.0%54.9%
Range20.0%53.9%
Mean7.3%14.4%
Median6.4%12.6%
Interquartile 25% (IQ1)4.6%9.0%
Interquartile 75% (IQ3)9.3%17.0%
Interquartile Range (IQR)4.7%8.0%
Standard Deviation (Sample)4.1%10.1%
Standard Deviation (Population)4.1%9.9%

Demographics Similar to Thais and Maltese by Child Poverty Under the Age of 16

In terms of child poverty under the age of 16, the demographic groups most similar to Thais are Chinese (11.9%, a difference of 3.1%), Filipino (11.1%, a difference of 3.9%), Immigrants from Hong Kong (12.1%, a difference of 5.0%), Iranian (12.2%, a difference of 5.8%), and Immigrants from Singapore (12.4%, a difference of 6.9%). Similarly, the demographic groups most similar to Maltese are Indian (Asian) (13.1%, a difference of 0.040%), Immigrants from Eastern Asia (13.1%, a difference of 0.080%), Okinawan (13.1%, a difference of 0.11%), Immigrants from Japan (13.0%, a difference of 0.70%), and Cypriot (13.0%, a difference of 0.74%).
DemographicsRating | RankChild Poverty Under the Age of 16
Filipinos
100.0
/100
|
#3
Exceptional
11.1%
Thais
100.0
/100
|
#4
Exceptional
11.6%
Chinese
100.0
/100
|
#5
Exceptional
11.9%
Immigrants | Hong Kong
100.0
/100
|
#6
Exceptional
12.1%
Iranians
100.0
/100
|
#7
Exceptional
12.2%
Immigrants | Singapore
100.0
/100
|
#8
Exceptional
12.4%
Immigrants | Iran
100.0
/100
|
#9
Exceptional
12.4%
Immigrants | South Central Asia
99.9
/100
|
#10
Exceptional
12.5%
Bhutanese
99.9
/100
|
#11
Exceptional
12.5%
Immigrants | Ireland
99.9
/100
|
#12
Exceptional
12.7%
Burmese
99.9
/100
|
#13
Exceptional
12.8%
Immigrants | Lithuania
99.9
/100
|
#14
Exceptional
12.9%
Immigrants | Korea
99.9
/100
|
#15
Exceptional
13.0%
Norwegians
99.9
/100
|
#16
Exceptional
13.0%
Bulgarians
99.9
/100
|
#17
Exceptional
13.0%
Cypriots
99.9
/100
|
#18
Exceptional
13.0%
Immigrants | Japan
99.8
/100
|
#19
Exceptional
13.0%
Okinawans
99.8
/100
|
#20
Exceptional
13.1%
Immigrants | Eastern Asia
99.8
/100
|
#21
Exceptional
13.1%
Maltese
99.8
/100
|
#22
Exceptional
13.1%
Indians (Asian)
99.8
/100
|
#23
Exceptional
13.1%