Delaware vs Somali Child Poverty Under the Age of 16
COMPARE
Delaware
Somali
Child Poverty Under the Age of 16
Child Poverty Under the Age of 16 Comparison
Delaware
Somalis
17.0%
CHILD POVERTY UNDER THE AGE OF 16
17.1/ 100
METRIC RATING
198th/ 347
METRIC RANK
21.0%
CHILD POVERTY UNDER THE AGE OF 16
0.0/ 100
METRIC RATING
304th/ 347
METRIC RANK
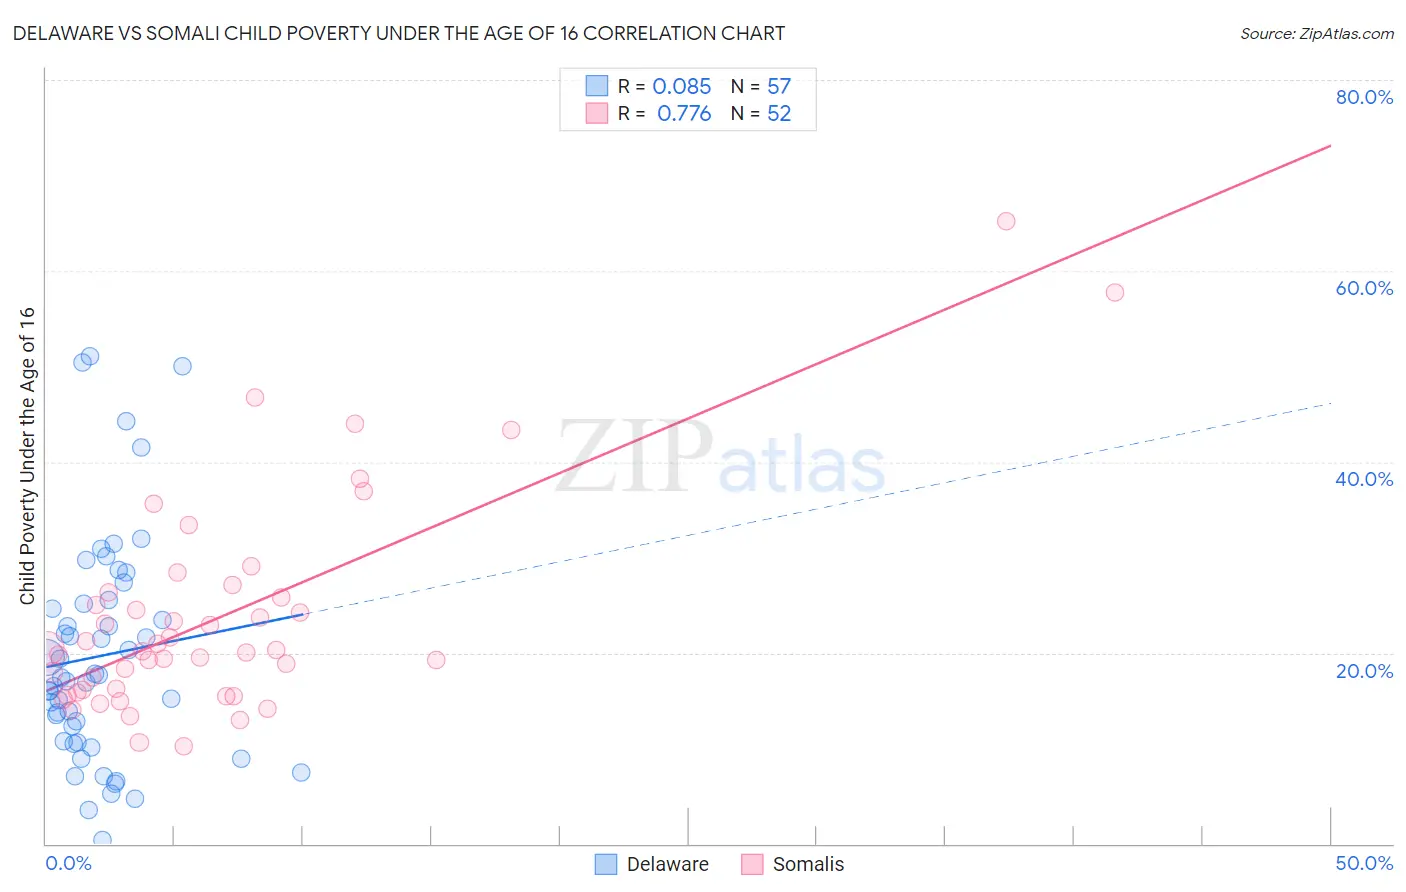
Delaware vs Somali Child Poverty Under the Age of 16 Correlation Chart
The statistical analysis conducted on geographies consisting of 95,926,108 people shows a slight positive correlation between the proportion of Delaware and poverty level among children under the age of 16 in the United States with a correlation coefficient (R) of 0.085 and weighted average of 17.0%. Similarly, the statistical analysis conducted on geographies consisting of 99,170,340 people shows a strong positive correlation between the proportion of Somalis and poverty level among children under the age of 16 in the United States with a correlation coefficient (R) of 0.776 and weighted average of 21.0%, a difference of 23.9%.
Child Poverty Under the Age of 16 Correlation Summary
| Measurement | Delaware | Somali |
| Minimum | 0.33% | 10.2% |
| Maximum | 51.0% | 65.2% |
| Range | 50.7% | 55.1% |
| Mean | 19.7% | 23.7% |
| Median | 17.4% | 20.2% |
| Interquartile 25% (IQ1) | 10.7% | 16.0% |
| Interquartile 75% (IQ3) | 25.3% | 26.1% |
| Interquartile Range (IQR) | 14.6% | 10.1% |
| Standard Deviation (Sample) | 11.7% | 11.3% |
| Standard Deviation (Population) | 11.6% | 11.2% |
Similar Demographics by Child Poverty Under the Age of 16
Demographics Similar to Delaware by Child Poverty Under the Age of 16
In terms of child poverty under the age of 16, the demographic groups most similar to Delaware are Immigrants from Kenya (16.9%, a difference of 0.40%), Immigrants from Afghanistan (17.0%, a difference of 0.41%), Immigrants from Cameroon (17.1%, a difference of 0.51%), Immigrants from Uzbekistan (17.1%, a difference of 0.52%), and Ugandan (17.1%, a difference of 0.60%).
| Demographics | Rating | Rank | Child Poverty Under the Age of 16 |
| Immigrants | Iraq | 28.3 /100 | #191 | Fair 16.7% |
| Spanish | 24.5 /100 | #192 | Fair 16.7% |
| Spaniards | 23.2 /100 | #193 | Fair 16.8% |
| Immigrants | Uruguay | 23.1 /100 | #194 | Fair 16.8% |
| Immigrants | Uganda | 22.5 /100 | #195 | Fair 16.8% |
| Immigrants | Lebanon | 22.0 /100 | #196 | Fair 16.8% |
| Immigrants | Kenya | 19.1 /100 | #197 | Poor 16.9% |
| Delaware | 17.1 /100 | #198 | Poor 17.0% |
| Immigrants | Afghanistan | 15.1 /100 | #199 | Poor 17.0% |
| Immigrants | Cameroon | 14.7 /100 | #200 | Poor 17.1% |
| Immigrants | Uzbekistan | 14.7 /100 | #201 | Poor 17.1% |
| Ugandans | 14.3 /100 | #202 | Poor 17.1% |
| Immigrants | Sierra Leone | 14.2 /100 | #203 | Poor 17.1% |
| Hmong | 14.0 /100 | #204 | Poor 17.1% |
| Aleuts | 13.9 /100 | #205 | Poor 17.1% |
Demographics Similar to Somalis by Child Poverty Under the Age of 16
In terms of child poverty under the age of 16, the demographic groups most similar to Somalis are Choctaw (21.0%, a difference of 0.050%), Immigrants from Bahamas (21.0%, a difference of 0.090%), Immigrants from Grenada (21.0%, a difference of 0.33%), Indonesian (21.0%, a difference of 0.37%), and Seminole (21.1%, a difference of 0.47%).
| Demographics | Rating | Rank | Child Poverty Under the Age of 16 |
| Hispanics or Latinos | 0.0 /100 | #297 | Tragic 20.8% |
| Arapaho | 0.0 /100 | #298 | Tragic 20.8% |
| Immigrants | Haiti | 0.0 /100 | #299 | Tragic 20.9% |
| Indonesians | 0.0 /100 | #300 | Tragic 21.0% |
| Immigrants | Grenada | 0.0 /100 | #301 | Tragic 21.0% |
| Immigrants | Bahamas | 0.0 /100 | #302 | Tragic 21.0% |
| Choctaw | 0.0 /100 | #303 | Tragic 21.0% |
| Somalis | 0.0 /100 | #304 | Tragic 21.0% |
| Seminole | 0.0 /100 | #305 | Tragic 21.1% |
| Guatemalans | 0.0 /100 | #306 | Tragic 21.2% |
| Immigrants | Central America | 0.0 /100 | #307 | Tragic 21.3% |
| British West Indians | 0.0 /100 | #308 | Tragic 21.3% |
| Immigrants | Mexico | 0.0 /100 | #309 | Tragic 21.5% |
| Bahamians | 0.0 /100 | #310 | Tragic 21.5% |
| Dutch West Indians | 0.0 /100 | #311 | Tragic 21.5% |