Immigrants from Kuwait vs Immigrants from Philippines Male Poverty
COMPARE
Immigrants from Kuwait
Immigrants from Philippines
Male Poverty
Male Poverty Comparison
Immigrants from Kuwait
Immigrants from Philippines
11.6%
MALE POVERTY
17.3/ 100
METRIC RATING
193rd/ 347
METRIC RANK
10.0%
MALE POVERTY
98.7/ 100
METRIC RATING
50th/ 347
METRIC RANK
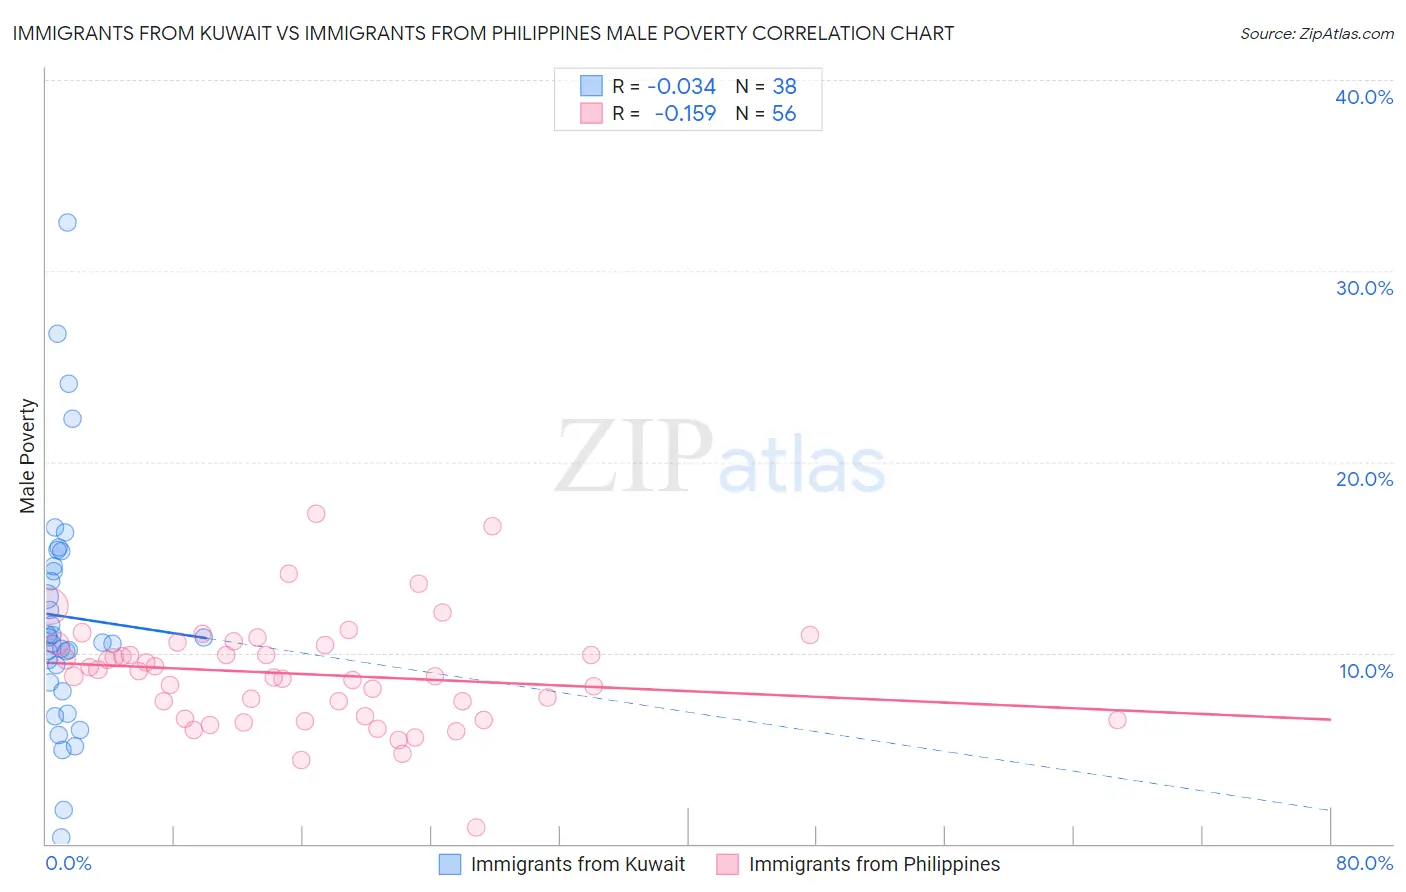
Immigrants from Kuwait vs Immigrants from Philippines Male Poverty Correlation Chart
The statistical analysis conducted on geographies consisting of 136,838,263 people shows no correlation between the proportion of Immigrants from Kuwait and poverty level among males in the United States with a correlation coefficient (R) of -0.034 and weighted average of 11.6%. Similarly, the statistical analysis conducted on geographies consisting of 470,810,616 people shows a poor negative correlation between the proportion of Immigrants from Philippines and poverty level among males in the United States with a correlation coefficient (R) of -0.159 and weighted average of 10.0%, a difference of 16.3%.
Male Poverty Correlation Summary
| Measurement | Immigrants from Kuwait | Immigrants from Philippines |
| Minimum | 0.32% | 0.87% |
| Maximum | 32.5% | 17.3% |
| Range | 32.2% | 16.4% |
| Mean | 11.9% | 8.9% |
| Median | 10.7% | 8.9% |
| Interquartile 25% (IQ1) | 8.4% | 6.6% |
| Interquartile 75% (IQ3) | 14.6% | 10.4% |
| Interquartile Range (IQR) | 6.1% | 3.8% |
| Standard Deviation (Sample) | 6.4% | 2.8% |
| Standard Deviation (Population) | 6.3% | 2.8% |
Similar Demographics by Male Poverty
Demographics Similar to Immigrants from Kuwait by Male Poverty
In terms of male poverty, the demographic groups most similar to Immigrants from Kuwait are Immigrants from Kenya (11.6%, a difference of 0.21%), Arab (11.6%, a difference of 0.26%), Hmong (11.6%, a difference of 0.27%), Immigrants from Uruguay (11.6%, a difference of 0.29%), and Delaware (11.7%, a difference of 0.33%).
| Demographics | Rating | Rank | Male Poverty |
| Immigrants | Sierra Leone | 32.9 /100 | #186 | Fair 11.4% |
| Immigrants | Iraq | 31.9 /100 | #187 | Fair 11.4% |
| Sierra Leoneans | 29.9 /100 | #188 | Fair 11.4% |
| Hawaiians | 28.3 /100 | #189 | Fair 11.4% |
| Israelis | 26.1 /100 | #190 | Fair 11.5% |
| South American Indians | 22.8 /100 | #191 | Fair 11.5% |
| Immigrants | Uruguay | 19.1 /100 | #192 | Poor 11.6% |
| Immigrants | Kuwait | 17.3 /100 | #193 | Poor 11.6% |
| Immigrants | Kenya | 16.1 /100 | #194 | Poor 11.6% |
| Arabs | 15.8 /100 | #195 | Poor 11.6% |
| Hmong | 15.8 /100 | #196 | Poor 11.6% |
| Delaware | 15.4 /100 | #197 | Poor 11.7% |
| Iraqis | 14.7 /100 | #198 | Poor 11.7% |
| Spanish | 14.1 /100 | #199 | Poor 11.7% |
| Immigrants | Lebanon | 13.6 /100 | #200 | Poor 11.7% |
Demographics Similar to Immigrants from Philippines by Male Poverty
In terms of male poverty, the demographic groups most similar to Immigrants from Philippines are Slovene (10.0%, a difference of 0.050%), Immigrants from Croatia (10.0%, a difference of 0.10%), Immigrants from Japan (10.0%, a difference of 0.14%), Immigrants from Singapore (10.0%, a difference of 0.15%), and Asian (10.0%, a difference of 0.19%).
| Demographics | Rating | Rank | Male Poverty |
| Immigrants | Moldova | 99.0 /100 | #43 | Exceptional 9.9% |
| Immigrants | Romania | 98.9 /100 | #44 | Exceptional 9.9% |
| Immigrants | Serbia | 98.9 /100 | #45 | Exceptional 10.0% |
| Turks | 98.9 /100 | #46 | Exceptional 10.0% |
| Immigrants | Singapore | 98.8 /100 | #47 | Exceptional 10.0% |
| Immigrants | Japan | 98.8 /100 | #48 | Exceptional 10.0% |
| Slovenes | 98.8 /100 | #49 | Exceptional 10.0% |
| Immigrants | Philippines | 98.7 /100 | #50 | Exceptional 10.0% |
| Immigrants | Croatia | 98.7 /100 | #51 | Exceptional 10.0% |
| Asians | 98.7 /100 | #52 | Exceptional 10.0% |
| Immigrants | Czechoslovakia | 98.6 /100 | #53 | Exceptional 10.0% |
| Immigrants | Austria | 98.5 /100 | #54 | Exceptional 10.0% |
| Germans | 98.3 /100 | #55 | Exceptional 10.1% |
| Immigrants | Bulgaria | 98.2 /100 | #56 | Exceptional 10.1% |
| Estonians | 98.1 /100 | #57 | Exceptional 10.1% |