Immigrants from Australia vs Immigrants from Philippines Male Poverty
COMPARE
Immigrants from Australia
Immigrants from Philippines
Male Poverty
Male Poverty Comparison
Immigrants from Australia
Immigrants from Philippines
10.2%
MALE POVERTY
97.1/ 100
METRIC RATING
69th/ 347
METRIC RANK
10.0%
MALE POVERTY
98.7/ 100
METRIC RATING
50th/ 347
METRIC RANK
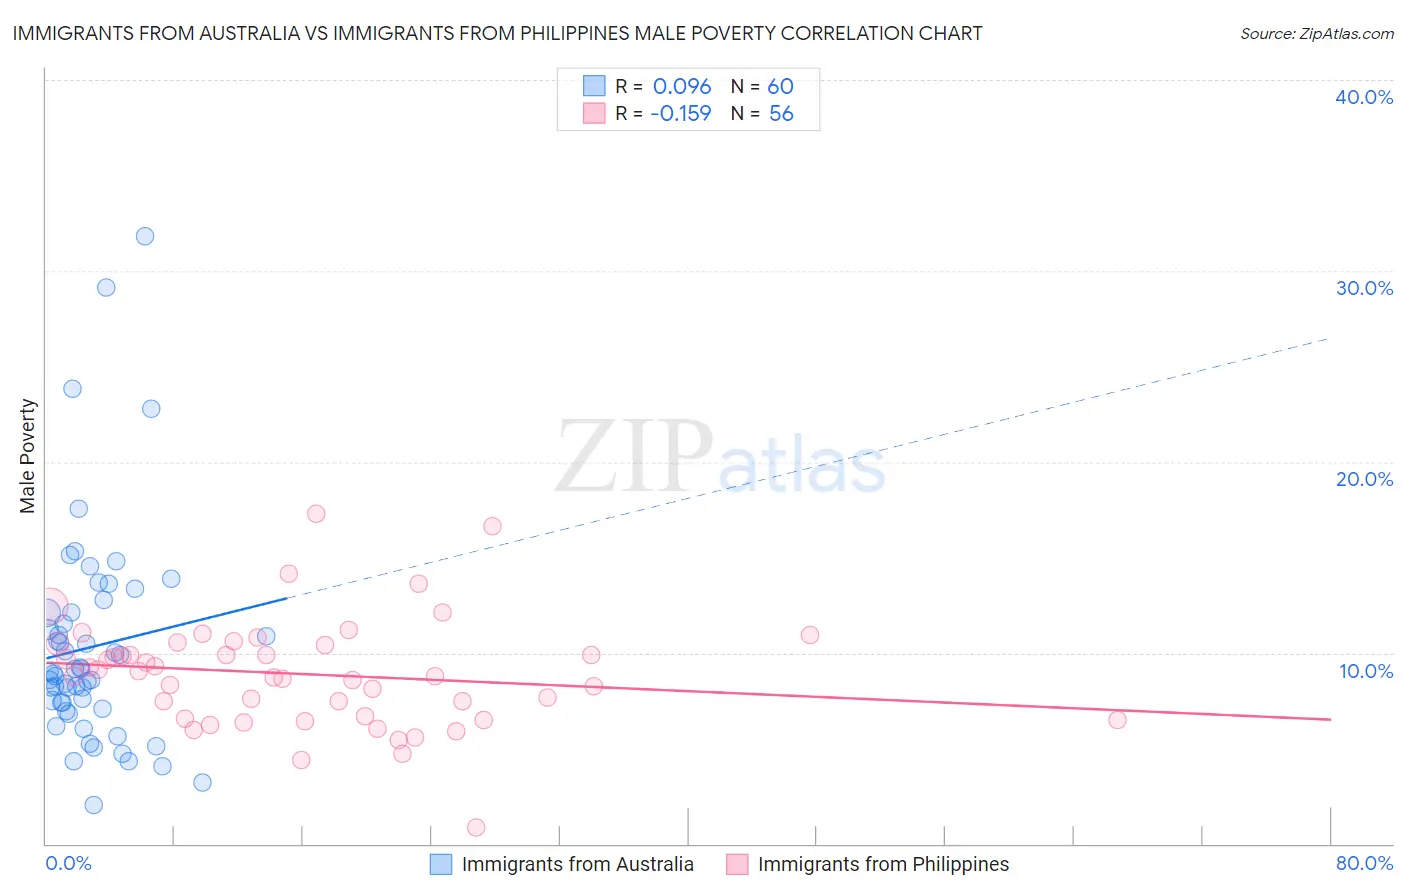
Immigrants from Australia vs Immigrants from Philippines Male Poverty Correlation Chart
The statistical analysis conducted on geographies consisting of 227,114,617 people shows a slight positive correlation between the proportion of Immigrants from Australia and poverty level among males in the United States with a correlation coefficient (R) of 0.096 and weighted average of 10.2%. Similarly, the statistical analysis conducted on geographies consisting of 470,810,616 people shows a poor negative correlation between the proportion of Immigrants from Philippines and poverty level among males in the United States with a correlation coefficient (R) of -0.159 and weighted average of 10.0%, a difference of 2.3%.
Male Poverty Correlation Summary
| Measurement | Immigrants from Australia | Immigrants from Philippines |
| Minimum | 2.0% | 0.87% |
| Maximum | 31.8% | 17.3% |
| Range | 29.8% | 16.4% |
| Mean | 10.3% | 8.9% |
| Median | 8.9% | 8.9% |
| Interquartile 25% (IQ1) | 7.2% | 6.6% |
| Interquartile 75% (IQ3) | 12.1% | 10.4% |
| Interquartile Range (IQR) | 4.9% | 3.8% |
| Standard Deviation (Sample) | 5.6% | 2.8% |
| Standard Deviation (Population) | 5.6% | 2.8% |
Demographics Similar to Immigrants from Australia and Immigrants from Philippines by Male Poverty
In terms of male poverty, the demographic groups most similar to Immigrants from Australia are Immigrants from Sri Lanka (10.2%, a difference of 0.13%), Immigrants from Netherlands (10.2%, a difference of 0.18%), Serbian (10.2%, a difference of 0.36%), Zimbabwean (10.2%, a difference of 0.37%), and Swiss (10.2%, a difference of 0.44%). Similarly, the demographic groups most similar to Immigrants from Philippines are Slovene (10.0%, a difference of 0.050%), Immigrants from Croatia (10.0%, a difference of 0.10%), Asian (10.0%, a difference of 0.19%), Immigrants from Czechoslovakia (10.0%, a difference of 0.27%), and Immigrants from Austria (10.0%, a difference of 0.55%).
| Demographics | Rating | Rank | Male Poverty |
| Slovenes | 98.8 /100 | #49 | Exceptional 10.0% |
| Immigrants | Philippines | 98.7 /100 | #50 | Exceptional 10.0% |
| Immigrants | Croatia | 98.7 /100 | #51 | Exceptional 10.0% |
| Asians | 98.7 /100 | #52 | Exceptional 10.0% |
| Immigrants | Czechoslovakia | 98.6 /100 | #53 | Exceptional 10.0% |
| Immigrants | Austria | 98.5 /100 | #54 | Exceptional 10.0% |
| Germans | 98.3 /100 | #55 | Exceptional 10.1% |
| Immigrants | Bulgaria | 98.2 /100 | #56 | Exceptional 10.1% |
| Estonians | 98.1 /100 | #57 | Exceptional 10.1% |
| Scandinavians | 98.0 /100 | #58 | Exceptional 10.1% |
| Immigrants | Europe | 97.9 /100 | #59 | Exceptional 10.1% |
| Ukrainians | 97.9 /100 | #60 | Exceptional 10.1% |
| Austrians | 97.8 /100 | #61 | Exceptional 10.1% |
| Immigrants | Italy | 97.8 /100 | #62 | Exceptional 10.2% |
| Slovaks | 97.7 /100 | #63 | Exceptional 10.2% |
| Swiss | 97.5 /100 | #64 | Exceptional 10.2% |
| Zimbabweans | 97.5 /100 | #65 | Exceptional 10.2% |
| Serbians | 97.5 /100 | #66 | Exceptional 10.2% |
| Immigrants | Netherlands | 97.3 /100 | #67 | Exceptional 10.2% |
| Immigrants | Sri Lanka | 97.2 /100 | #68 | Exceptional 10.2% |
| Immigrants | Australia | 97.1 /100 | #69 | Exceptional 10.2% |