Danish vs Menominee Unemployment Among Youth under 25 years
COMPARE
Danish
Menominee
Unemployment Among Youth under 25 years
Unemployment Among Youth under 25 years Comparison
Danes
Menominee
10.3%
UNEMPLOYMENT AMONG YOUTH UNDER 25 YEARS
100.0/ 100
METRIC RATING
6th/ 347
METRIC RANK
10.6%
UNEMPLOYMENT AMONG YOUTH UNDER 25 YEARS
100.0/ 100
METRIC RATING
17th/ 347
METRIC RANK
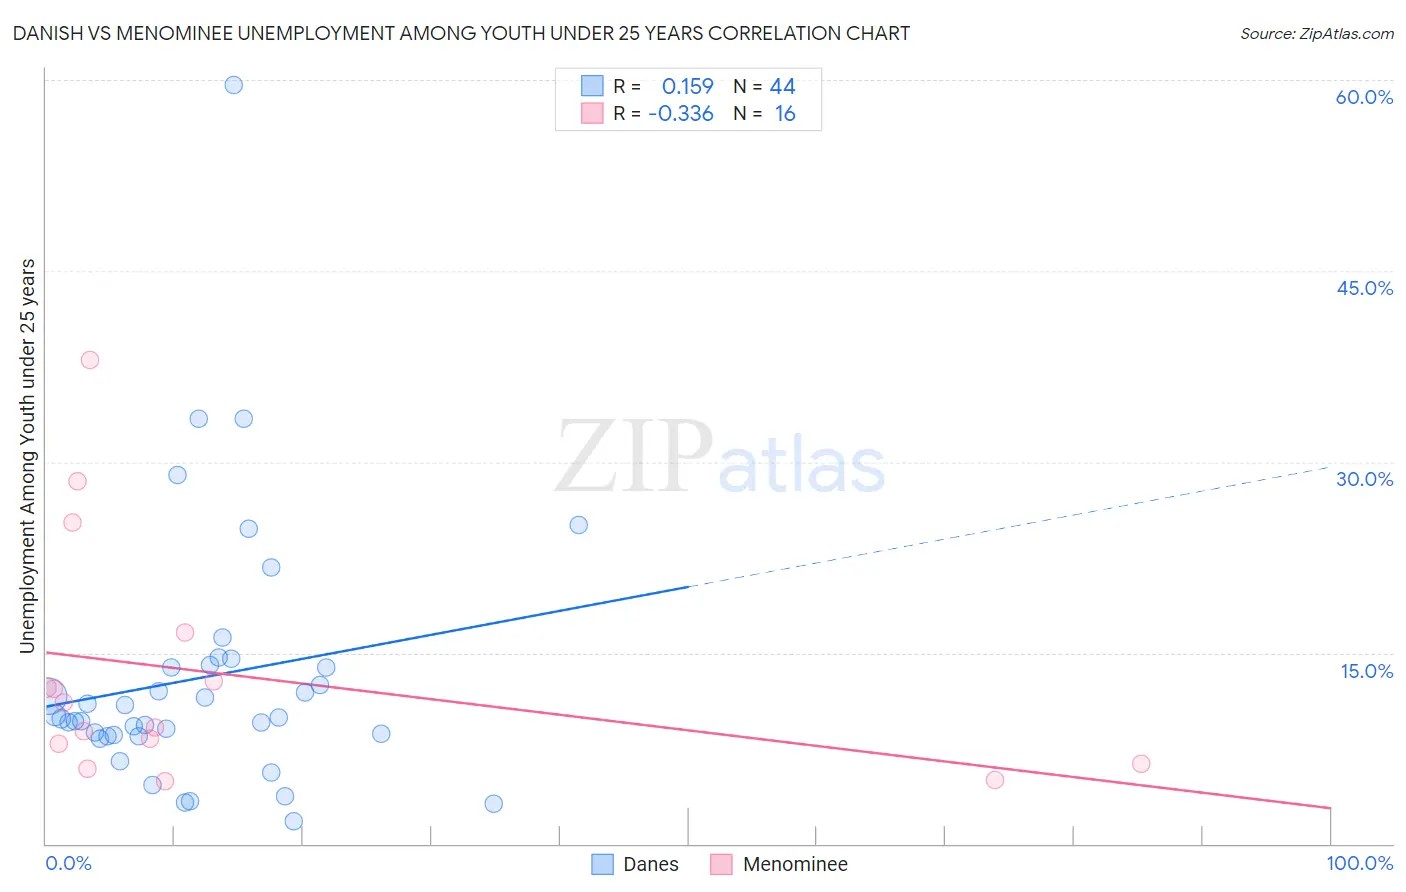
Danish vs Menominee Unemployment Among Youth under 25 years Correlation Chart
The statistical analysis conducted on geographies consisting of 461,773,143 people shows a poor positive correlation between the proportion of Danes and unemployment rate among youth under the age of 25 in the United States with a correlation coefficient (R) of 0.159 and weighted average of 10.3%. Similarly, the statistical analysis conducted on geographies consisting of 45,608,918 people shows a mild negative correlation between the proportion of Menominee and unemployment rate among youth under the age of 25 in the United States with a correlation coefficient (R) of -0.336 and weighted average of 10.6%, a difference of 2.6%.
Unemployment Among Youth under 25 years Correlation Summary
| Measurement | Danish | Menominee |
| Minimum | 1.8% | 4.9% |
| Maximum | 59.6% | 38.0% |
| Range | 57.8% | 33.1% |
| Mean | 13.0% | 13.3% |
| Median | 9.9% | 10.1% |
| Interquartile 25% (IQ1) | 8.5% | 7.1% |
| Interquartile 75% (IQ3) | 13.9% | 14.7% |
| Interquartile Range (IQR) | 5.4% | 7.6% |
| Standard Deviation (Sample) | 10.3% | 9.4% |
| Standard Deviation (Population) | 10.2% | 9.1% |
Demographics Similar to Danes and Menominee by Unemployment Among Youth under 25 years
In terms of unemployment among youth under 25 years, the demographic groups most similar to Danes are Czech (10.3%, a difference of 0.16%), Swedish (10.4%, a difference of 0.75%), Zimbabwean (10.2%, a difference of 1.2%), Immigrants from Venezuela (10.5%, a difference of 1.5%), and German (10.5%, a difference of 1.9%). Similarly, the demographic groups most similar to Menominee are Sudanese (10.6%, a difference of 0.050%), Venezuelan (10.6%, a difference of 0.050%), Swiss (10.6%, a difference of 0.16%), Cuban (10.6%, a difference of 0.17%), and Immigrants from Burma/Myanmar (10.6%, a difference of 0.17%).
| Demographics | Rating | Rank | Unemployment Among Youth under 25 years |
| Norwegians | 100.0 /100 | #1 | Exceptional 9.8% |
| Immigrants | Cuba | 100.0 /100 | #2 | Exceptional 10.0% |
| Luxembourgers | 100.0 /100 | #3 | Exceptional 10.0% |
| Zimbabweans | 100.0 /100 | #4 | Exceptional 10.2% |
| Czechs | 100.0 /100 | #5 | Exceptional 10.3% |
| Danes | 100.0 /100 | #6 | Exceptional 10.3% |
| Swedes | 100.0 /100 | #7 | Exceptional 10.4% |
| Immigrants | Venezuela | 100.0 /100 | #8 | Exceptional 10.5% |
| Germans | 100.0 /100 | #9 | Exceptional 10.5% |
| Immigrants | Somalia | 100.0 /100 | #10 | Exceptional 10.5% |
| Scandinavians | 100.0 /100 | #11 | Exceptional 10.5% |
| Immigrants | Sudan | 100.0 /100 | #12 | Exceptional 10.5% |
| Indonesians | 100.0 /100 | #13 | Exceptional 10.6% |
| Cubans | 100.0 /100 | #14 | Exceptional 10.6% |
| Sudanese | 100.0 /100 | #15 | Exceptional 10.6% |
| Venezuelans | 100.0 /100 | #16 | Exceptional 10.6% |
| Menominee | 100.0 /100 | #17 | Exceptional 10.6% |
| Swiss | 100.0 /100 | #18 | Exceptional 10.6% |
| Immigrants | Burma/Myanmar | 100.0 /100 | #19 | Exceptional 10.6% |
| Dutch | 100.0 /100 | #20 | Exceptional 10.6% |
| Pennsylvania Germans | 100.0 /100 | #21 | Exceptional 10.6% |