Danish vs Bahamian 3rd Grade
COMPARE
Danish
Bahamian
3rd Grade
3rd Grade Comparison
Danes
Bahamians
98.5%
3RD GRADE
100.0/ 100
METRIC RATING
24th/ 347
METRIC RANK
97.5%
3RD GRADE
4.4/ 100
METRIC RATING
224th/ 347
METRIC RANK
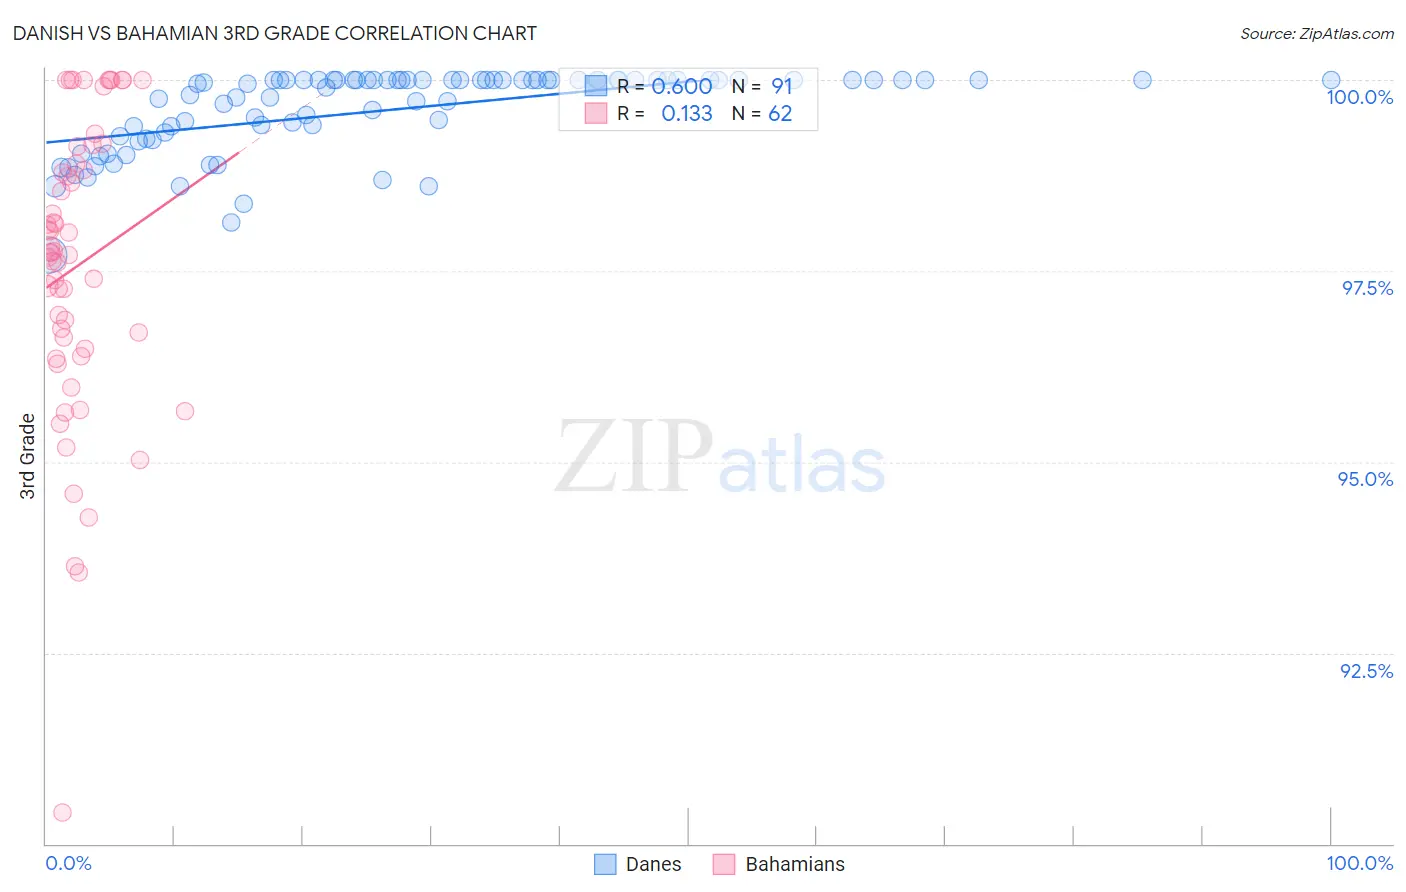
Danish vs Bahamian 3rd Grade Correlation Chart
The statistical analysis conducted on geographies consisting of 474,193,610 people shows a significant positive correlation between the proportion of Danes and percentage of population with at least 3rd grade education in the United States with a correlation coefficient (R) of 0.600 and weighted average of 98.5%. Similarly, the statistical analysis conducted on geographies consisting of 112,697,105 people shows a poor positive correlation between the proportion of Bahamians and percentage of population with at least 3rd grade education in the United States with a correlation coefficient (R) of 0.133 and weighted average of 97.5%, a difference of 0.99%.
3rd Grade Correlation Summary
| Measurement | Danish | Bahamian |
| Minimum | 97.7% | 90.4% |
| Maximum | 100.0% | 100.0% |
| Range | 2.3% | 9.6% |
| Mean | 99.6% | 97.6% |
| Median | 100.0% | 97.7% |
| Interquartile 25% (IQ1) | 99.3% | 96.5% |
| Interquartile 75% (IQ3) | 100.0% | 98.9% |
| Interquartile Range (IQR) | 0.74% | 2.4% |
| Standard Deviation (Sample) | 0.54% | 1.9% |
| Standard Deviation (Population) | 0.53% | 1.9% |
Similar Demographics by 3rd Grade
Demographics Similar to Danes by 3rd Grade
In terms of 3rd grade, the demographic groups most similar to Danes are Scotch-Irish (98.5%, a difference of 0.0%), Lithuanian (98.5%, a difference of 0.010%), Finnish (98.5%, a difference of 0.010%), Sioux (98.5%, a difference of 0.010%), and Aleut (98.5%, a difference of 0.010%).
| Demographics | Rating | Rank | 3rd Grade |
| Dutch | 100.0 /100 | #17 | Exceptional 98.5% |
| Irish | 100.0 /100 | #18 | Exceptional 98.5% |
| Poles | 100.0 /100 | #19 | Exceptional 98.5% |
| Pennsylvania Germans | 100.0 /100 | #20 | Exceptional 98.5% |
| Lithuanians | 100.0 /100 | #21 | Exceptional 98.5% |
| Finns | 100.0 /100 | #22 | Exceptional 98.5% |
| Sioux | 100.0 /100 | #23 | Exceptional 98.5% |
| Danes | 100.0 /100 | #24 | Exceptional 98.5% |
| Scotch-Irish | 100.0 /100 | #25 | Exceptional 98.5% |
| Aleuts | 100.0 /100 | #26 | Exceptional 98.5% |
| Croatians | 100.0 /100 | #27 | Exceptional 98.5% |
| French | 100.0 /100 | #28 | Exceptional 98.4% |
| French Canadians | 100.0 /100 | #29 | Exceptional 98.4% |
| Europeans | 100.0 /100 | #30 | Exceptional 98.4% |
| Czechs | 100.0 /100 | #31 | Exceptional 98.4% |
Demographics Similar to Bahamians by 3rd Grade
In terms of 3rd grade, the demographic groups most similar to Bahamians are Sierra Leonean (97.5%, a difference of 0.0%), Immigrants from Syria (97.5%, a difference of 0.0%), Tongan (97.5%, a difference of 0.0%), Immigrants from Morocco (97.5%, a difference of 0.010%), and Uruguayan (97.5%, a difference of 0.010%).
| Demographics | Rating | Rank | 3rd Grade |
| South American Indians | 5.7 /100 | #217 | Tragic 97.5% |
| Immigrants | Nepal | 5.3 /100 | #218 | Tragic 97.5% |
| Immigrants | Panama | 5.2 /100 | #219 | Tragic 97.5% |
| Immigrants | Morocco | 5.0 /100 | #220 | Tragic 97.5% |
| Uruguayans | 5.0 /100 | #221 | Tragic 97.5% |
| Sierra Leoneans | 4.6 /100 | #222 | Tragic 97.5% |
| Immigrants | Syria | 4.4 /100 | #223 | Tragic 97.5% |
| Bahamians | 4.4 /100 | #224 | Tragic 97.5% |
| Tongans | 4.3 /100 | #225 | Tragic 97.5% |
| Sudanese | 4.1 /100 | #226 | Tragic 97.5% |
| Immigrants | Sudan | 3.4 /100 | #227 | Tragic 97.5% |
| Sub-Saharan Africans | 3.2 /100 | #228 | Tragic 97.5% |
| Senegalese | 3.0 /100 | #229 | Tragic 97.5% |
| Immigrants | Pakistan | 2.7 /100 | #230 | Tragic 97.5% |
| Immigrants | Costa Rica | 2.7 /100 | #231 | Tragic 97.5% |