Czech vs Immigrants from England Female Poverty

COMPARE

Czech
Race
Ancestry
AfghanAfricanAlaska NativeAlaskan AthabascanAlbanianAleutAlsatianAmericanApacheArabArapahoArgentineanArmenianAssyrian/Chaldean/SyriacAustralianAustrianBahamianBangladeshiBarbadianBasqueBelgianBelizeanBermudanBhutaneseBlackfeetBolivianBrazilianBritishBritish West IndianBulgarianBurmeseCajunCambodianCanadianCape VerdeanCarpatho RusynCelticCentral AmericanCentral American IndianCherokeeCheyenneChickasawChileanChineseChippewaChoctawColombianColvilleComancheCosta RicanCreeCreekCroatianCrowCubanCypriotCzechCzechoslovakianDanishDelawareDominicanDutchDutch West IndianEastern EuropeanEcuadorianEgyptianEnglishEstonianEthiopianEuropeanFijianFilipinoFinnishFrenchFrench American IndianFrench CanadianGermanGerman RussianGhanaianGreekGuamanian/ChamorroGuatemalanGuyaneseHaitianHmongHonduranHopiHoumaHungarianIcelanderIndian (Asian)IndonesianInupiatIranianIraqiIrishIroquoisIsraeliItalianJamaicanJapaneseJordanianKenyanKiowaKoreanLaotianLatvianLebaneseLiberianLithuanianLumbeeLuxembourgerMacedonianMalaysianMalteseMarshalleseMenomineeMexicanMexican American IndianMongolianMoroccanNative HawaiianNavajoNepaleseNew ZealanderNicaraguanNigerianNorthern EuropeanNorwegianOkinawanOsageOttawaPaiutePakistaniPalestinianPanamanianParaguayanPennsylvania GermanPeruvianPimaPolishPortuguesePotawatomiPuebloPuerto RicanPuget Sound SalishRomanianRussianSalvadoranSamoanScandinavianScotch-IrishScottishSeminoleSenegaleseSerbianShoshoneSierra LeoneanSiouxSlavicSlovakSloveneSomaliSouth AfricanSouth AmericanSouth American IndianSoviet UnionSpaniardSpanishSpanish AmericanSpanish American IndianSri LankanSubsaharan AfricanSudaneseSwedishSwissSyrianTaiwaneseThaiTlingit-HaidaTohono O'OdhamTonganTrinidadian and TobagonianTsimshianTurkishU.S. Virgin IslanderUgandanUkrainianUruguayanUteVenezuelanVietnameseWelshWest IndianYakamaYaquiYugoslavianYumanYup'ikZimbabwean
Immigration
NonimmigrantsImmigrantsAfghanistanAfricaAlbaniaArgentinaArmeniaAsiaAustraliaAustriaBahamasBangladeshBarbadosBelarusBelgiumBelizeBoliviaBosnia and HerzegovinaBrazilBulgariaBurma/MyanmarCabo VerdeCambodiaCameroonCanadaCaribbeanCentral AmericaChileChinaColombiaCongoCosta RicaCroatiaCubaCzechoslovakiaDenmarkDominicaDominican RepublicEastern AfricaEastern AsiaEastern EuropeEcuadorEgyptEl SalvadorEritreaEthiopiaEuropeFijiFranceGermanyGhanaGreeceGrenadaGuatemalaGuyanaHaitiHondurasHong KongHungaryIndiaIndonesiaIranIraqIrelandIsraelItalyJamaicaJapanJordanKazakhstanKenyaKoreaKuwaitLaosLatin AmericaLatviaLebanonLiberiaLithuaniaMalaysiaMexicoMicronesiaMiddle AfricaMoldovaMoroccoNepalNetherlandsNicaraguaNigeriaNorth AmericaNorth MacedoniaNorthern AfricaNorthern EuropeNorwayOceaniaPakistanPanamaPeruPhilippinesPolandPortugalRomaniaRussiaSaudi ArabiaScotlandSenegalSerbiaSierra LeoneSingaporeSomaliaSouth AfricaSouth AmericaSouth Central AsiaSouth Eastern AsiaSouthern EuropeSpainSri LankaSt. Vincent and the GrenadinesSudanSwedenSwitzerlandSyriaTaiwanThailandTrinidad and TobagoTurkeyUgandaUkraineUruguayUzbekistanVenezuelaVietnamWest IndiesWestern AfricaWestern AsiaWestern EuropeYemenZaireZimbabweAzores
Immigrants from England
Race
Ancestry
AfghanAfricanAlaska NativeAlaskan AthabascanAlbanianAleutAlsatianAmericanApacheArabArapahoArgentineanArmenianAssyrian/Chaldean/SyriacAustralianAustrianBahamianBangladeshiBarbadianBasqueBelgianBelizeanBermudanBhutaneseBlackfeetBolivianBrazilianBritishBritish West IndianBulgarianBurmeseCajunCambodianCanadianCape VerdeanCarpatho RusynCelticCentral AmericanCentral American IndianCherokeeCheyenneChickasawChileanChineseChippewaChoctawColombianColvilleComancheCosta RicanCreeCreekCroatianCrowCubanCypriotCzechoslovakianDanishDelawareDominicanDutchDutch West IndianEastern EuropeanEcuadorianEgyptianEnglishEstonianEthiopianEuropeanFijianFilipinoFinnishFrenchFrench American IndianFrench CanadianGermanGerman RussianGhanaianGreekGuamanian/ChamorroGuatemalanGuyaneseHaitianHmongHonduranHopiHoumaHungarianIcelanderIndian (Asian)IndonesianInupiatIranianIraqiIrishIroquoisIsraeliItalianJamaicanJapaneseJordanianKenyanKiowaKoreanLaotianLatvianLebaneseLiberianLithuanianLumbeeLuxembourgerMacedonianMalaysianMalteseMarshalleseMenomineeMexicanMexican American IndianMongolianMoroccanNative HawaiianNavajoNepaleseNew ZealanderNicaraguanNigerianNorthern EuropeanNorwegianOkinawanOsageOttawaPaiutePakistaniPalestinianPanamanianParaguayanPennsylvania GermanPeruvianPimaPolishPortuguesePotawatomiPuebloPuerto RicanPuget Sound SalishRomanianRussianSalvadoranSamoanScandinavianScotch-IrishScottishSeminoleSenegaleseSerbianShoshoneSierra LeoneanSiouxSlavicSlovakSloveneSomaliSouth AfricanSouth AmericanSouth American IndianSoviet UnionSpaniardSpanishSpanish AmericanSpanish American IndianSri LankanSubsaharan AfricanSudaneseSwedishSwissSyrianTaiwaneseThaiTlingit-HaidaTohono O'OdhamTonganTrinidadian and TobagonianTsimshianTurkishU.S. Virgin IslanderUgandanUkrainianUruguayanUteVenezuelanVietnameseWelshWest IndianYakamaYaquiYugoslavianYumanYup'ikZimbabwean
Immigration
NonimmigrantsImmigrantsAfghanistanAfricaAlbaniaArgentinaArmeniaAsiaAustraliaAustriaBahamasBangladeshBarbadosBelarusBelgiumBelizeBoliviaBosnia and HerzegovinaBrazilBulgariaBurma/MyanmarCabo VerdeCambodiaCameroonCanadaCaribbeanCentral AmericaChileChinaColombiaCongoCosta RicaCroatiaCubaCzechoslovakiaDenmarkDominicaDominican RepublicEastern AfricaEastern AsiaEastern EuropeEcuadorEgyptEl SalvadorEnglandEritreaEthiopiaEuropeFijiFranceGermanyGhanaGreeceGrenadaGuatemalaGuyanaHaitiHondurasHong KongHungaryIndiaIndonesiaIranIraqIrelandIsraelItalyJamaicaJapanJordanKazakhstanKenyaKoreaKuwaitLaosLatin AmericaLatviaLebanonLiberiaLithuaniaMalaysiaMexicoMicronesiaMiddle AfricaMoldovaMoroccoNepalNetherlandsNicaraguaNigeriaNorth AmericaNorth MacedoniaNorthern AfricaNorthern EuropeNorwayOceaniaPakistanPanamaPeruPhilippinesPolandPortugalRomaniaRussiaSaudi ArabiaScotlandSenegalSerbiaSierra LeoneSingaporeSomaliaSouth AfricaSouth AmericaSouth Central AsiaSouth Eastern AsiaSouthern EuropeSpainSri LankaSt. Vincent and the GrenadinesSudanSwedenSwitzerlandSyriaTaiwanThailandTrinidad and TobagoTurkeyUgandaUkraineUruguayUzbekistanVenezuelaVietnamWest IndiesWestern AfricaWestern AsiaWestern EuropeYemenZaireZimbabweAzores
Female Poverty
Income
Poverty
Unemployment
Labor Participation
Family Structure
Vehicle Availability
Education Level
Disability

Female Poverty Comparison

Czechs

Immigrants from England

Exceptional
Exceptional
11.9%
FEMALE POVERTY
99.2/ 100
METRIC RATING
41st/ 347
METRIC RANK
12.3%
FEMALE POVERTY
96.9/ 100
METRIC RATING
83rd/ 347
METRIC RANK

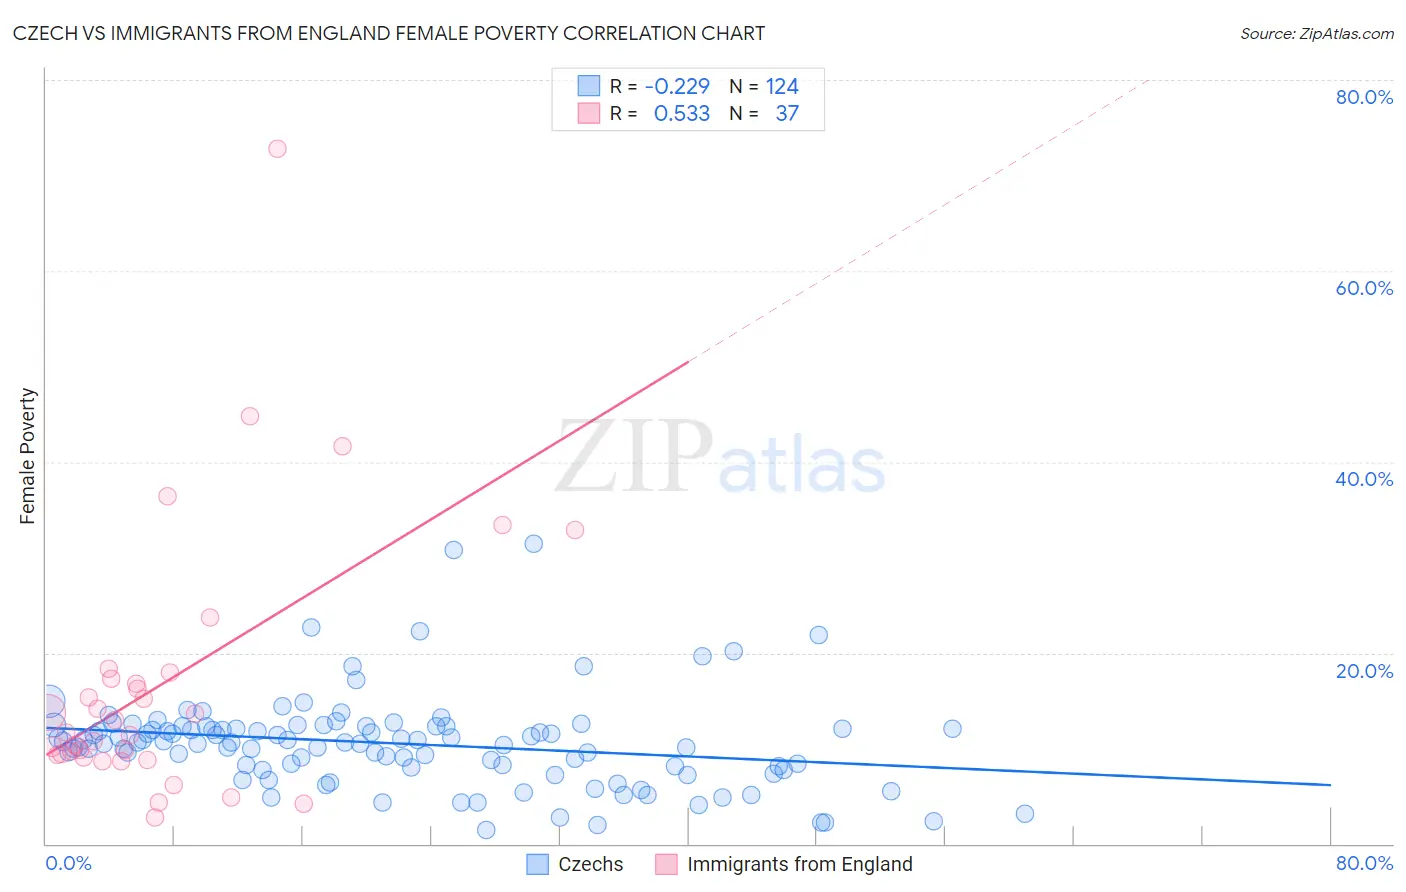
Czech vs Immigrants from England Female Poverty Correlation Chart

The statistical analysis conducted on geographies consisting of 484,224,691 people shows a weak negative correlation between the proportion of Czechs and poverty level among females in the United States with a correlation coefficient (R) of -0.229 and weighted average of 11.9%. Similarly, the statistical analysis conducted on geographies consisting of 391,675,853 people shows a substantial positive correlation between the proportion of Immigrants from England and poverty level among females in the United States with a correlation coefficient (R) of 0.533 and weighted average of 12.3%, a difference of 3.9%.
Czech vs Immigrants from England Female Poverty

Female Poverty Correlation Summary

MeasurementCzechImmigrants from England
Minimum1.4%2.7%
Maximum31.4%72.8%
Range29.9%70.1%
Mean10.5%16.7%
Median10.6%11.6%
Interquartile 25% (IQ1)8.0%9.2%
Interquartile 75% (IQ3)12.3%17.6%
Interquartile Range (IQR)4.2%8.4%
Standard Deviation (Sample)4.8%13.9%
Standard Deviation (Population)4.8%13.8%

Similar Demographics by Female Poverty

Demographics Similar to Czechs by Female Poverty

In terms of female poverty, the demographic groups most similar to Czechs are Immigrants from Moldova (11.9%, a difference of 0.0%), Korean (11.9%, a difference of 0.040%), Tongan (11.9%, a difference of 0.11%), Macedonian (11.8%, a difference of 0.18%), and Immigrants from Czechoslovakia (11.9%, a difference of 0.20%).
DemographicsRating | RankFemale Poverty
Immigrants | Singapore
99.4
/100
|
#34
Exceptional
11.8%
Immigrants | Iran
99.4
/100
|
#35
Exceptional
11.8%
Immigrants | Pakistan
99.4
/100
|
#36
Exceptional
11.8%
Immigrants | Greece
99.3
/100
|
#37
Exceptional
11.8%
Russians
99.3
/100
|
#38
Exceptional
11.8%
Immigrants | Poland
99.3
/100
|
#39
Exceptional
11.8%
Macedonians
99.3
/100
|
#40
Exceptional
11.8%
Czechs
99.2
/100
|
#41
Exceptional
11.9%
Immigrants | Moldova
99.2
/100
|
#42
Exceptional
11.9%
Koreans
99.2
/100
|
#43
Exceptional
11.9%
Tongans
99.2
/100
|
#44
Exceptional
11.9%
Immigrants | Czechoslovakia
99.2
/100
|
#45
Exceptional
11.9%
Turks
99.2
/100
|
#46
Exceptional
11.9%
Asians
99.1
/100
|
#47
Exceptional
11.9%
Immigrants | Japan
99.0
/100
|
#48
Exceptional
11.9%

Demographics Similar to Immigrants from England by Female Poverty

In terms of female poverty, the demographic groups most similar to Immigrants from England are Jordanian (12.3%, a difference of 0.18%), Slovak (12.3%, a difference of 0.19%), Immigrants from Sweden (12.3%, a difference of 0.19%), Northern European (12.4%, a difference of 0.23%), and Immigrants from North America (12.3%, a difference of 0.24%).
DemographicsRating | RankFemale Poverty
Immigrants | Eastern Europe
97.2
/100
|
#76
Exceptional
12.3%
Serbians
97.2
/100
|
#77
Exceptional
12.3%
Egyptians
97.2
/100
|
#78
Exceptional
12.3%
Immigrants | North America
97.1
/100
|
#79
Exceptional
12.3%
Slovaks
97.1
/100
|
#80
Exceptional
12.3%
Immigrants | Sweden
97.1
/100
|
#81
Exceptional
12.3%
Jordanians
97.1
/100
|
#82
Exceptional
12.3%
Immigrants | England
96.9
/100
|
#83
Exceptional
12.3%
Northern Europeans
96.6
/100
|
#84
Exceptional
12.4%
Irish
96.5
/100
|
#85
Exceptional
12.4%
Dutch
96.5
/100
|
#86
Exceptional
12.4%
Okinawans
96.4
/100
|
#87
Exceptional
12.4%
Finns
96.4
/100
|
#88
Exceptional
12.4%
English
96.1
/100
|
#89
Exceptional
12.4%
Immigrants | Denmark
95.8
/100
|
#90
Exceptional
12.4%