Czechoslovakian vs U.S. Virgin Islander Unemployment Among Ages 16 to 19 years
COMPARE
Czechoslovakian
U.S. Virgin Islander
Unemployment Among Ages 16 to 19 years
Unemployment Among Ages 16 to 19 years Comparison
Czechoslovakians
U.S. Virgin Islanders
16.5%
UNEMPLOYMENT AMONG AGES 16 TO 19 YEARS
99.5/ 100
METRIC RATING
55th/ 347
METRIC RANK
21.3%
UNEMPLOYMENT AMONG AGES 16 TO 19 YEARS
0.0/ 100
METRIC RATING
306th/ 347
METRIC RANK
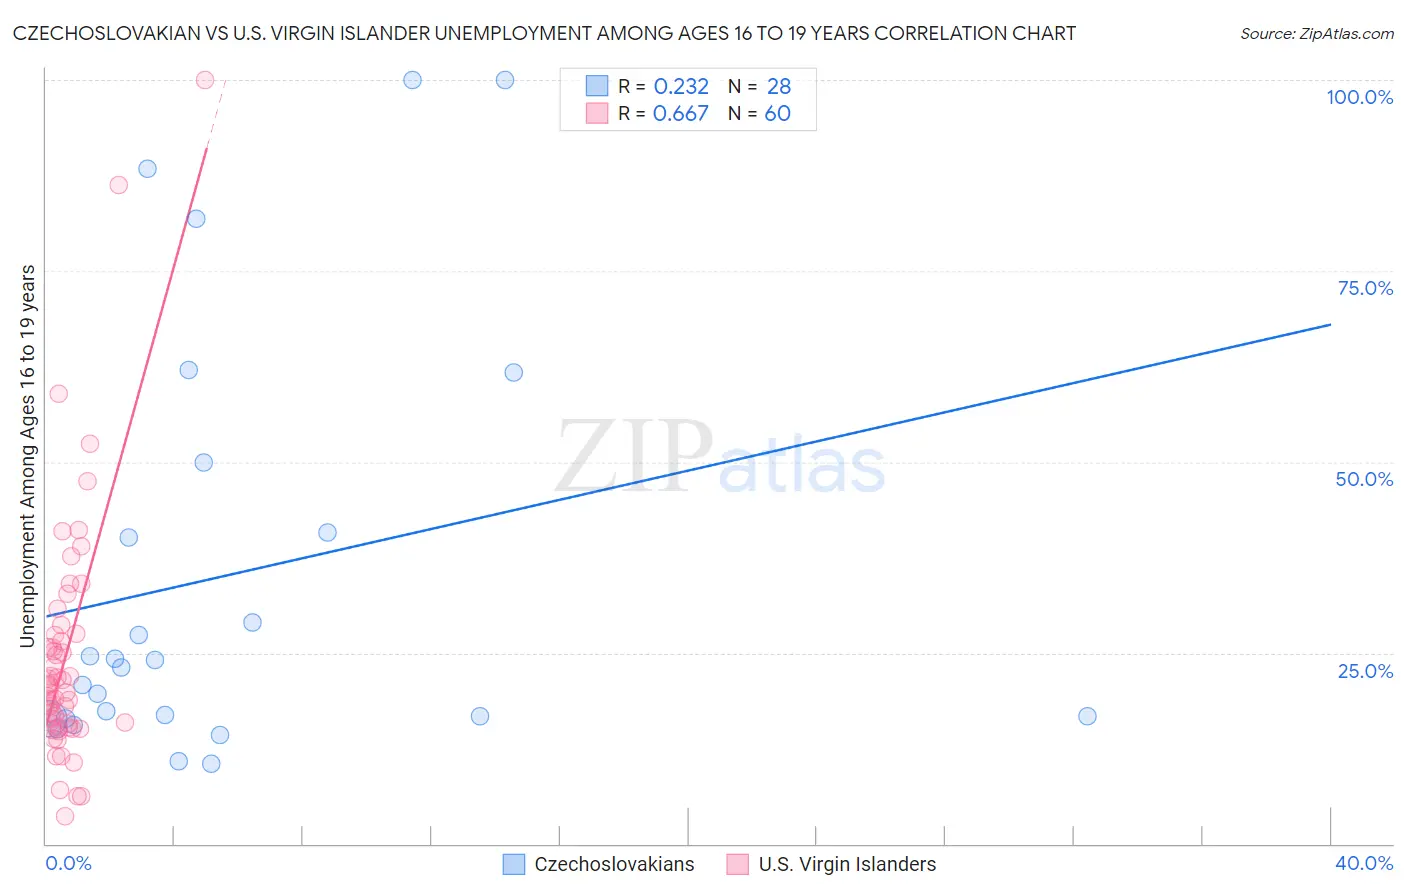
Czechoslovakian vs U.S. Virgin Islander Unemployment Among Ages 16 to 19 years Correlation Chart
The statistical analysis conducted on geographies consisting of 347,771,610 people shows a weak positive correlation between the proportion of Czechoslovakians and unemployment rate among population between the ages 16 and 19 in the United States with a correlation coefficient (R) of 0.232 and weighted average of 16.5%. Similarly, the statistical analysis conducted on geographies consisting of 86,637,334 people shows a significant positive correlation between the proportion of U.S. Virgin Islanders and unemployment rate among population between the ages 16 and 19 in the United States with a correlation coefficient (R) of 0.667 and weighted average of 21.3%, a difference of 29.2%.
Unemployment Among Ages 16 to 19 years Correlation Summary
| Measurement | Czechoslovakian | U.S. Virgin Islander |
| Minimum | 10.5% | 3.6% |
| Maximum | 100.0% | 100.0% |
| Range | 89.5% | 96.4% |
| Mean | 35.1% | 24.8% |
| Median | 23.5% | 20.7% |
| Interquartile 25% (IQ1) | 16.6% | 15.5% |
| Interquartile 75% (IQ3) | 45.4% | 27.4% |
| Interquartile Range (IQR) | 28.8% | 11.9% |
| Standard Deviation (Sample) | 27.6% | 16.8% |
| Standard Deviation (Population) | 27.1% | 16.7% |
Similar Demographics by Unemployment Among Ages 16 to 19 years
Demographics Similar to Czechoslovakians by Unemployment Among Ages 16 to 19 years
In terms of unemployment among ages 16 to 19 years, the demographic groups most similar to Czechoslovakians are British (16.5%, a difference of 0.020%), Sri Lankan (16.5%, a difference of 0.020%), Slovene (16.4%, a difference of 0.080%), Welsh (16.4%, a difference of 0.16%), and Lebanese (16.4%, a difference of 0.19%).
| Demographics | Rating | Rank | Unemployment Among Ages 16 to 19 years |
| Maltese | 99.7 /100 | #48 | Exceptional 16.4% |
| Iraqis | 99.7 /100 | #49 | Exceptional 16.4% |
| Bhutanese | 99.6 /100 | #50 | Exceptional 16.4% |
| Lebanese | 99.6 /100 | #51 | Exceptional 16.4% |
| Welsh | 99.6 /100 | #52 | Exceptional 16.4% |
| Slovenes | 99.6 /100 | #53 | Exceptional 16.4% |
| British | 99.5 /100 | #54 | Exceptional 16.5% |
| Czechoslovakians | 99.5 /100 | #55 | Exceptional 16.5% |
| Sri Lankans | 99.5 /100 | #56 | Exceptional 16.5% |
| Immigrants | Jordan | 99.4 /100 | #57 | Exceptional 16.5% |
| Immigrants | Uganda | 99.4 /100 | #58 | Exceptional 16.5% |
| Irish | 99.4 /100 | #59 | Exceptional 16.5% |
| Menominee | 99.3 /100 | #60 | Exceptional 16.6% |
| Immigrants | Cuba | 99.2 /100 | #61 | Exceptional 16.6% |
| Macedonians | 99.2 /100 | #62 | Exceptional 16.6% |
Demographics Similar to U.S. Virgin Islanders by Unemployment Among Ages 16 to 19 years
In terms of unemployment among ages 16 to 19 years, the demographic groups most similar to U.S. Virgin Islanders are Immigrants from Senegal (21.2%, a difference of 0.40%), Aleut (21.2%, a difference of 0.56%), Black/African American (21.4%, a difference of 0.58%), Immigrants from Bangladesh (21.5%, a difference of 0.97%), and Native/Alaskan (21.5%, a difference of 1.1%).
| Demographics | Rating | Rank | Unemployment Among Ages 16 to 19 years |
| Immigrants | Uzbekistan | 0.0 /100 | #299 | Tragic 20.5% |
| Ecuadorians | 0.0 /100 | #300 | Tragic 20.5% |
| Immigrants | Ecuador | 0.0 /100 | #301 | Tragic 20.9% |
| Immigrants | Caribbean | 0.0 /100 | #302 | Tragic 20.9% |
| Senegalese | 0.0 /100 | #303 | Tragic 21.0% |
| Aleuts | 0.0 /100 | #304 | Tragic 21.2% |
| Immigrants | Senegal | 0.0 /100 | #305 | Tragic 21.2% |
| U.S. Virgin Islanders | 0.0 /100 | #306 | Tragic 21.3% |
| Blacks/African Americans | 0.0 /100 | #307 | Tragic 21.4% |
| Immigrants | Bangladesh | 0.0 /100 | #308 | Tragic 21.5% |
| Natives/Alaskans | 0.0 /100 | #309 | Tragic 21.5% |
| Vietnamese | 0.0 /100 | #310 | Tragic 21.5% |
| Belizeans | 0.0 /100 | #311 | Tragic 21.6% |
| Houma | 0.0 /100 | #312 | Tragic 21.6% |
| Jamaicans | 0.0 /100 | #313 | Tragic 21.7% |