Immigrants from Scotland vs Immigrants from South Eastern Asia Female Poverty Among 25-34 Year Olds
COMPARE
Immigrants from Scotland
Immigrants from South Eastern Asia
Female Poverty Among 25-34 Year Olds
Female Poverty Among 25-34 Year Olds Comparison
Immigrants from Scotland
Immigrants from South Eastern Asia
12.2%
FEMALE POVERTY AMONG 25-34 YEAR OLDS
99.1/ 100
METRIC RATING
71st/ 347
METRIC RANK
12.5%
FEMALE POVERTY AMONG 25-34 YEAR OLDS
97.6/ 100
METRIC RATING
85th/ 347
METRIC RANK
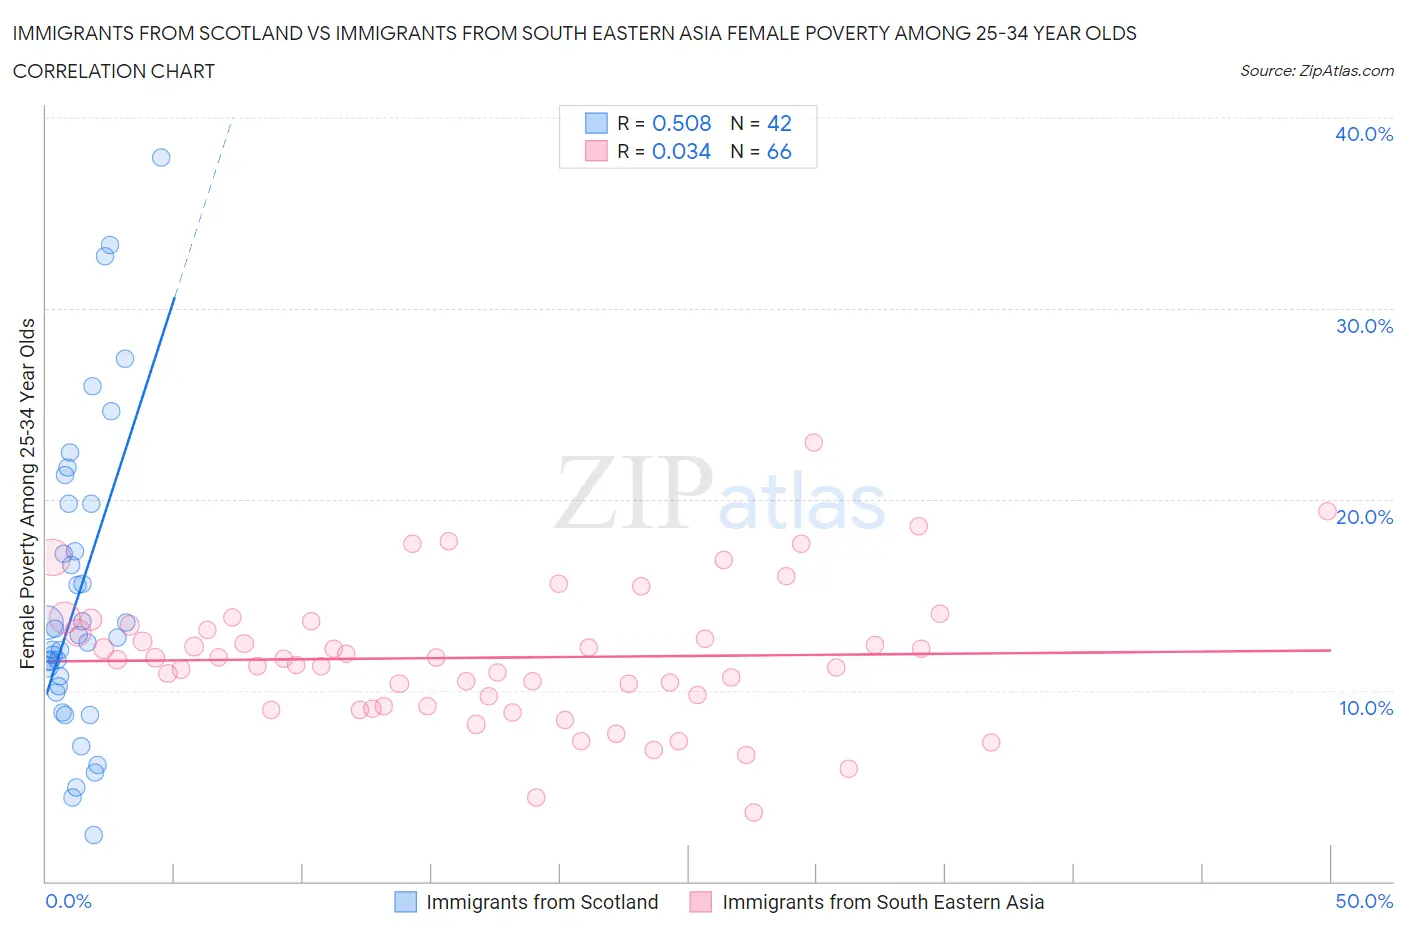
Immigrants from Scotland vs Immigrants from South Eastern Asia Female Poverty Among 25-34 Year Olds Correlation Chart
The statistical analysis conducted on geographies consisting of 194,153,517 people shows a substantial positive correlation between the proportion of Immigrants from Scotland and poverty level among females between the ages 25 and 34 in the United States with a correlation coefficient (R) of 0.508 and weighted average of 12.2%. Similarly, the statistical analysis conducted on geographies consisting of 499,745,803 people shows no correlation between the proportion of Immigrants from South Eastern Asia and poverty level among females between the ages 25 and 34 in the United States with a correlation coefficient (R) of 0.034 and weighted average of 12.5%, a difference of 2.3%.
Female Poverty Among 25-34 Year Olds Correlation Summary
| Measurement | Immigrants from Scotland | Immigrants from South Eastern Asia |
| Minimum | 2.4% | 3.6% |
| Maximum | 37.9% | 23.0% |
| Range | 35.5% | 19.4% |
| Mean | 15.0% | 11.7% |
| Median | 12.8% | 11.6% |
| Interquartile 25% (IQ1) | 10.2% | 9.2% |
| Interquartile 75% (IQ3) | 19.8% | 13.4% |
| Interquartile Range (IQR) | 9.6% | 4.2% |
| Standard Deviation (Sample) | 8.0% | 3.6% |
| Standard Deviation (Population) | 7.9% | 3.6% |
Demographics Similar to Immigrants from Scotland and Immigrants from South Eastern Asia by Female Poverty Among 25-34 Year Olds
In terms of female poverty among 25-34 year olds, the demographic groups most similar to Immigrants from Scotland are Immigrants from Belgium (12.2%, a difference of 0.010%), Immigrants from Lebanon (12.2%, a difference of 0.040%), Lithuanian (12.2%, a difference of 0.050%), Sri Lankan (12.2%, a difference of 0.070%), and Immigrants from Vietnam (12.3%, a difference of 0.36%). Similarly, the demographic groups most similar to Immigrants from South Eastern Asia are Croatian (12.5%, a difference of 0.010%), Argentinean (12.5%, a difference of 0.040%), Immigrants from Latvia (12.5%, a difference of 0.11%), Immigrants from Austria (12.5%, a difference of 0.11%), and Albanian (12.5%, a difference of 0.17%).
| Demographics | Rating | Rank | Female Poverty Among 25-34 Year Olds |
| Sri Lankans | 99.1 /100 | #68 | Exceptional 12.2% |
| Immigrants | Lebanon | 99.1 /100 | #69 | Exceptional 12.2% |
| Immigrants | Belgium | 99.1 /100 | #70 | Exceptional 12.2% |
| Immigrants | Scotland | 99.1 /100 | #71 | Exceptional 12.2% |
| Lithuanians | 99.1 /100 | #72 | Exceptional 12.2% |
| Immigrants | Vietnam | 98.9 /100 | #73 | Exceptional 12.3% |
| Immigrants | Sweden | 98.9 /100 | #74 | Exceptional 12.3% |
| Estonians | 98.9 /100 | #75 | Exceptional 12.3% |
| Greeks | 98.9 /100 | #76 | Exceptional 12.3% |
| Immigrants | Italy | 98.8 /100 | #77 | Exceptional 12.3% |
| Immigrants | Ukraine | 98.6 /100 | #78 | Exceptional 12.3% |
| Immigrants | Jordan | 98.5 /100 | #79 | Exceptional 12.4% |
| Immigrants | Malaysia | 98.3 /100 | #80 | Exceptional 12.4% |
| Immigrants | Kazakhstan | 98.1 /100 | #81 | Exceptional 12.4% |
| Ethiopians | 98.0 /100 | #82 | Exceptional 12.4% |
| Albanians | 97.7 /100 | #83 | Exceptional 12.5% |
| Immigrants | Latvia | 97.7 /100 | #84 | Exceptional 12.5% |
| Immigrants | South Eastern Asia | 97.6 /100 | #85 | Exceptional 12.5% |
| Croatians | 97.5 /100 | #86 | Exceptional 12.5% |
| Argentineans | 97.5 /100 | #87 | Exceptional 12.5% |
| Immigrants | Austria | 97.4 /100 | #88 | Exceptional 12.5% |