Czechoslovakian vs Salvadoran Female Poverty Among 25-34 Year Olds
COMPARE
Czechoslovakian
Salvadoran
Female Poverty Among 25-34 Year Olds
Female Poverty Among 25-34 Year Olds Comparison
Czechoslovakians
Salvadorans
13.7%
FEMALE POVERTY AMONG 25-34 YEAR OLDS
36.8/ 100
METRIC RATING
184th/ 347
METRIC RANK
14.7%
FEMALE POVERTY AMONG 25-34 YEAR OLDS
1.4/ 100
METRIC RATING
236th/ 347
METRIC RANK
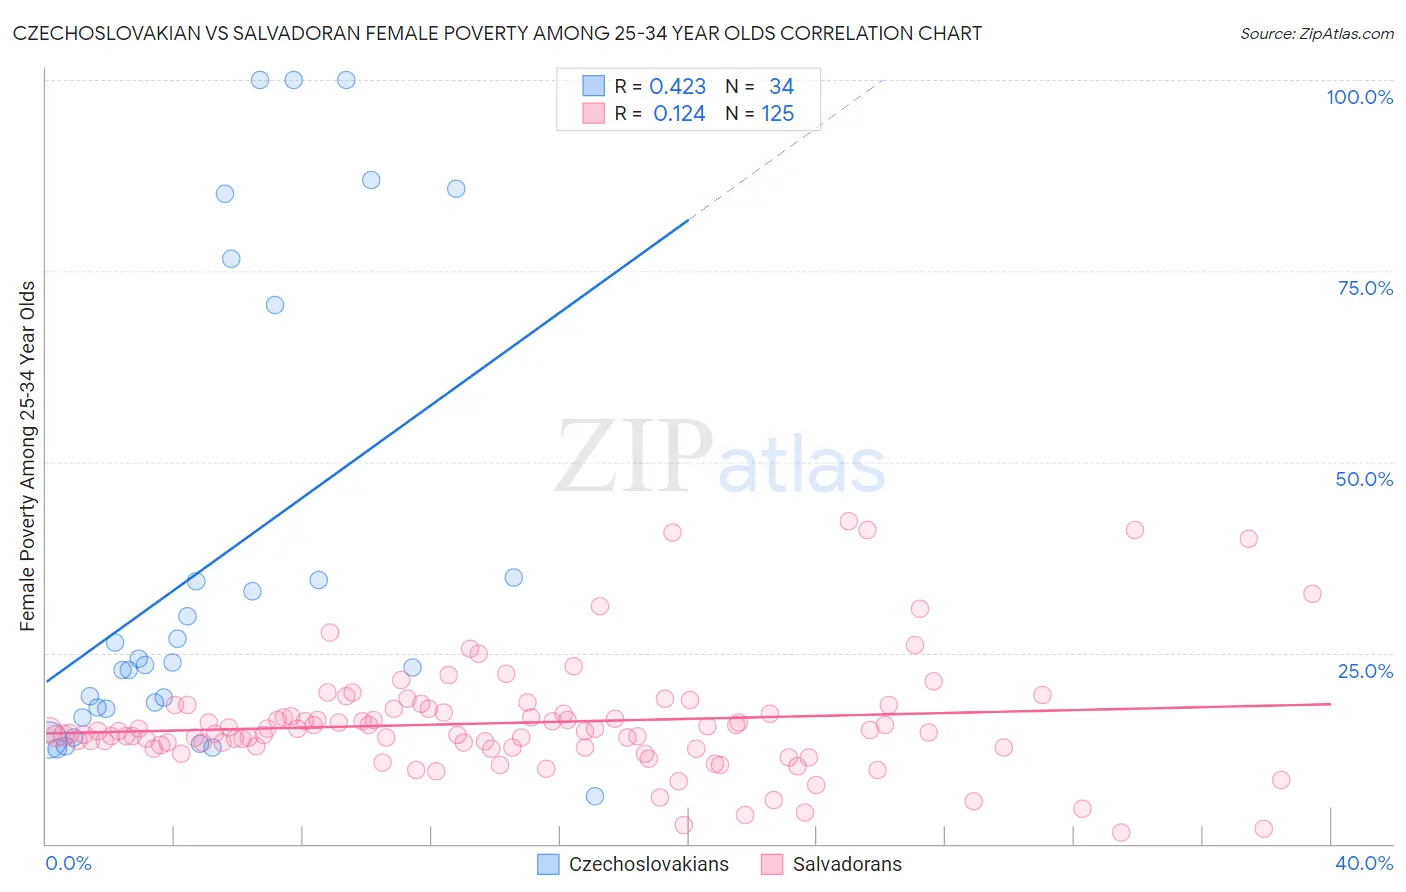
Czechoslovakian vs Salvadoran Female Poverty Among 25-34 Year Olds Correlation Chart
The statistical analysis conducted on geographies consisting of 361,442,854 people shows a moderate positive correlation between the proportion of Czechoslovakians and poverty level among females between the ages 25 and 34 in the United States with a correlation coefficient (R) of 0.423 and weighted average of 13.7%. Similarly, the statistical analysis conducted on geographies consisting of 394,044,278 people shows a poor positive correlation between the proportion of Salvadorans and poverty level among females between the ages 25 and 34 in the United States with a correlation coefficient (R) of 0.124 and weighted average of 14.7%, a difference of 7.6%.
Female Poverty Among 25-34 Year Olds Correlation Summary
| Measurement | Czechoslovakian | Salvadoran |
| Minimum | 6.2% | 1.5% |
| Maximum | 100.0% | 42.2% |
| Range | 93.8% | 40.7% |
| Mean | 37.0% | 15.8% |
| Median | 23.6% | 14.7% |
| Interquartile 25% (IQ1) | 17.7% | 12.6% |
| Interquartile 75% (IQ3) | 34.8% | 17.4% |
| Interquartile Range (IQR) | 17.1% | 4.8% |
| Standard Deviation (Sample) | 30.0% | 7.4% |
| Standard Deviation (Population) | 29.6% | 7.3% |
Similar Demographics by Female Poverty Among 25-34 Year Olds
Demographics Similar to Czechoslovakians by Female Poverty Among 25-34 Year Olds
In terms of female poverty among 25-34 year olds, the demographic groups most similar to Czechoslovakians are Irish (13.7%, a difference of 0.13%), Immigrants from Uruguay (13.7%, a difference of 0.24%), Slovak (13.7%, a difference of 0.24%), Portuguese (13.6%, a difference of 0.31%), and Immigrants from Venezuela (13.6%, a difference of 0.34%).
| Demographics | Rating | Rank | Female Poverty Among 25-34 Year Olds |
| Venezuelans | 44.6 /100 | #177 | Average 13.6% |
| Canadians | 44.3 /100 | #178 | Average 13.6% |
| Immigrants | Eastern Africa | 43.6 /100 | #179 | Average 13.6% |
| Germans | 41.6 /100 | #180 | Average 13.6% |
| Guamanians/Chamorros | 41.5 /100 | #181 | Average 13.6% |
| Immigrants | Venezuela | 40.7 /100 | #182 | Average 13.6% |
| Portuguese | 40.3 /100 | #183 | Average 13.6% |
| Czechoslovakians | 36.8 /100 | #184 | Fair 13.7% |
| Irish | 35.3 /100 | #185 | Fair 13.7% |
| Immigrants | Uruguay | 34.1 /100 | #186 | Fair 13.7% |
| Slovaks | 34.1 /100 | #187 | Fair 13.7% |
| Immigrants | Eritrea | 32.7 /100 | #188 | Fair 13.7% |
| Finns | 32.5 /100 | #189 | Fair 13.7% |
| Dutch | 29.7 /100 | #190 | Fair 13.8% |
| Immigrants | St. Vincent and the Grenadines | 29.3 /100 | #191 | Fair 13.8% |
Demographics Similar to Salvadorans by Female Poverty Among 25-34 Year Olds
In terms of female poverty among 25-34 year olds, the demographic groups most similar to Salvadorans are Immigrants from Ghana (14.7%, a difference of 0.0%), Immigrants from Jamaica (14.7%, a difference of 0.020%), Alsatian (14.7%, a difference of 0.040%), Malaysian (14.7%, a difference of 0.070%), and Immigrants from Grenada (14.7%, a difference of 0.12%).
| Demographics | Rating | Rank | Female Poverty Among 25-34 Year Olds |
| Spanish | 2.5 /100 | #229 | Tragic 14.6% |
| Spaniards | 2.3 /100 | #230 | Tragic 14.6% |
| Delaware | 2.3 /100 | #231 | Tragic 14.6% |
| Immigrants | Ecuador | 1.9 /100 | #232 | Tragic 14.6% |
| Whites/Caucasians | 1.8 /100 | #233 | Tragic 14.7% |
| Cubans | 1.6 /100 | #234 | Tragic 14.7% |
| Immigrants | Jamaica | 1.4 /100 | #235 | Tragic 14.7% |
| Salvadorans | 1.4 /100 | #236 | Tragic 14.7% |
| Immigrants | Ghana | 1.4 /100 | #237 | Tragic 14.7% |
| Alsatians | 1.4 /100 | #238 | Tragic 14.7% |
| Malaysians | 1.4 /100 | #239 | Tragic 14.7% |
| Immigrants | Grenada | 1.3 /100 | #240 | Tragic 14.7% |
| Scotch-Irish | 1.2 /100 | #241 | Tragic 14.8% |
| Barbadians | 1.2 /100 | #242 | Tragic 14.8% |
| Immigrants | Nicaragua | 1.1 /100 | #243 | Tragic 14.8% |