Central American Indian vs Sri Lankan Receiving Food Stamps
COMPARE
Central American Indian
Sri Lankan
Receiving Food Stamps
Receiving Food Stamps Comparison
Central American Indians
Sri Lankans
17.1%
RECEIVING FOOD STAMPS
0.0/ 100
METRIC RATING
316th/ 347
METRIC RANK
10.6%
RECEIVING FOOD STAMPS
93.7/ 100
METRIC RATING
122nd/ 347
METRIC RANK
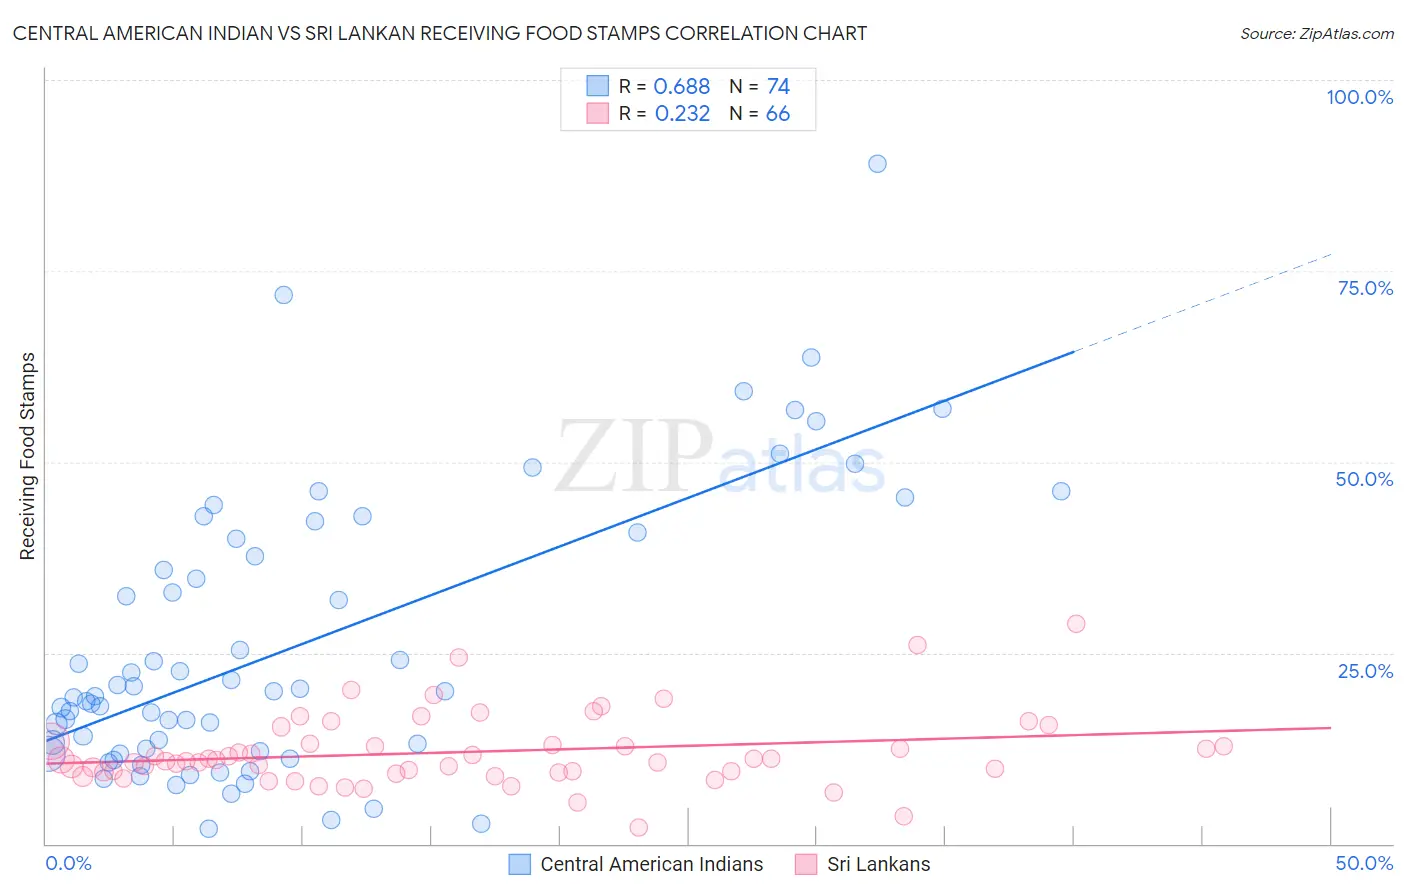
Central American Indian vs Sri Lankan Receiving Food Stamps Correlation Chart
The statistical analysis conducted on geographies consisting of 325,864,154 people shows a significant positive correlation between the proportion of Central American Indians and percentage of population receiving government assistance and/or food stamps in the United States with a correlation coefficient (R) of 0.688 and weighted average of 17.1%. Similarly, the statistical analysis conducted on geographies consisting of 439,146,185 people shows a weak positive correlation between the proportion of Sri Lankans and percentage of population receiving government assistance and/or food stamps in the United States with a correlation coefficient (R) of 0.232 and weighted average of 10.6%, a difference of 60.7%.
Receiving Food Stamps Correlation Summary
| Measurement | Central American Indian | Sri Lankan |
| Minimum | 1.9% | 2.2% |
| Maximum | 89.1% | 28.8% |
| Range | 87.2% | 26.6% |
| Mean | 25.9% | 12.0% |
| Median | 19.6% | 10.9% |
| Interquartile 25% (IQ1) | 12.1% | 9.4% |
| Interquartile 75% (IQ3) | 40.0% | 13.1% |
| Interquartile Range (IQR) | 27.9% | 3.7% |
| Standard Deviation (Sample) | 18.3% | 4.8% |
| Standard Deviation (Population) | 18.2% | 4.7% |
Similar Demographics by Receiving Food Stamps
Demographics Similar to Central American Indians by Receiving Food Stamps
In terms of receiving food stamps, the demographic groups most similar to Central American Indians are Bahamian (17.0%, a difference of 0.45%), Black/African American (17.2%, a difference of 0.53%), Menominee (17.2%, a difference of 0.70%), Immigrants from St. Vincent and the Grenadines (17.2%, a difference of 0.88%), and Immigrants from Nicaragua (17.2%, a difference of 0.96%).
| Demographics | Rating | Rank | Receiving Food Stamps |
| U.S. Virgin Islanders | 0.0 /100 | #309 | Tragic 16.5% |
| Immigrants | Barbados | 0.0 /100 | #310 | Tragic 16.6% |
| Guyanese | 0.0 /100 | #311 | Tragic 16.7% |
| Sioux | 0.0 /100 | #312 | Tragic 16.8% |
| Immigrants | Jamaica | 0.0 /100 | #313 | Tragic 16.9% |
| Immigrants | Guyana | 0.0 /100 | #314 | Tragic 16.9% |
| Bahamians | 0.0 /100 | #315 | Tragic 17.0% |
| Central American Indians | 0.0 /100 | #316 | Tragic 17.1% |
| Blacks/African Americans | 0.0 /100 | #317 | Tragic 17.2% |
| Menominee | 0.0 /100 | #318 | Tragic 17.2% |
| Immigrants | St. Vincent and the Grenadines | 0.0 /100 | #319 | Tragic 17.2% |
| Immigrants | Nicaragua | 0.0 /100 | #320 | Tragic 17.2% |
| Natives/Alaskans | 0.0 /100 | #321 | Tragic 17.3% |
| Immigrants | Grenada | 0.0 /100 | #322 | Tragic 17.8% |
| Haitians | 0.0 /100 | #323 | Tragic 17.8% |
Demographics Similar to Sri Lankans by Receiving Food Stamps
In terms of receiving food stamps, the demographic groups most similar to Sri Lankans are Slavic (10.6%, a difference of 0.070%), Immigrants from Poland (10.6%, a difference of 0.11%), Ethiopian (10.6%, a difference of 0.11%), Immigrants from Philippines (10.7%, a difference of 0.25%), and Assyrian/Chaldean/Syriac (10.6%, a difference of 0.27%).
| Demographics | Rating | Rank | Receiving Food Stamps |
| Immigrants | Saudi Arabia | 94.9 /100 | #115 | Exceptional 10.5% |
| Canadians | 94.8 /100 | #116 | Exceptional 10.5% |
| Immigrants | Nepal | 94.6 /100 | #117 | Exceptional 10.6% |
| Assyrians/Chaldeans/Syriacs | 94.1 /100 | #118 | Exceptional 10.6% |
| Immigrants | Poland | 93.9 /100 | #119 | Exceptional 10.6% |
| Ethiopians | 93.9 /100 | #120 | Exceptional 10.6% |
| Slavs | 93.8 /100 | #121 | Exceptional 10.6% |
| Sri Lankans | 93.7 /100 | #122 | Exceptional 10.6% |
| Immigrants | Philippines | 93.3 /100 | #123 | Exceptional 10.7% |
| Paraguayans | 93.0 /100 | #124 | Exceptional 10.7% |
| Ukrainians | 92.8 /100 | #125 | Exceptional 10.7% |
| Afghans | 92.6 /100 | #126 | Exceptional 10.7% |
| Immigrants | Ethiopia | 92.6 /100 | #127 | Exceptional 10.7% |
| Immigrants | Jordan | 92.5 /100 | #128 | Exceptional 10.7% |
| Yugoslavians | 92.5 /100 | #129 | Exceptional 10.7% |