Samoan vs Immigrants from West Indies Child Poverty Among Boys Under 16
COMPARE
Samoan
Immigrants from West Indies
Child Poverty Among Boys Under 16
Child Poverty Among Boys Under 16 Comparison
Samoans
Immigrants from West Indies
15.7%
CHILD POVERTY AMONG BOYS UNDER 16
83.2/ 100
METRIC RATING
145th/ 347
METRIC RANK
20.0%
CHILD POVERTY AMONG BOYS UNDER 16
0.0/ 100
METRIC RATING
278th/ 347
METRIC RANK
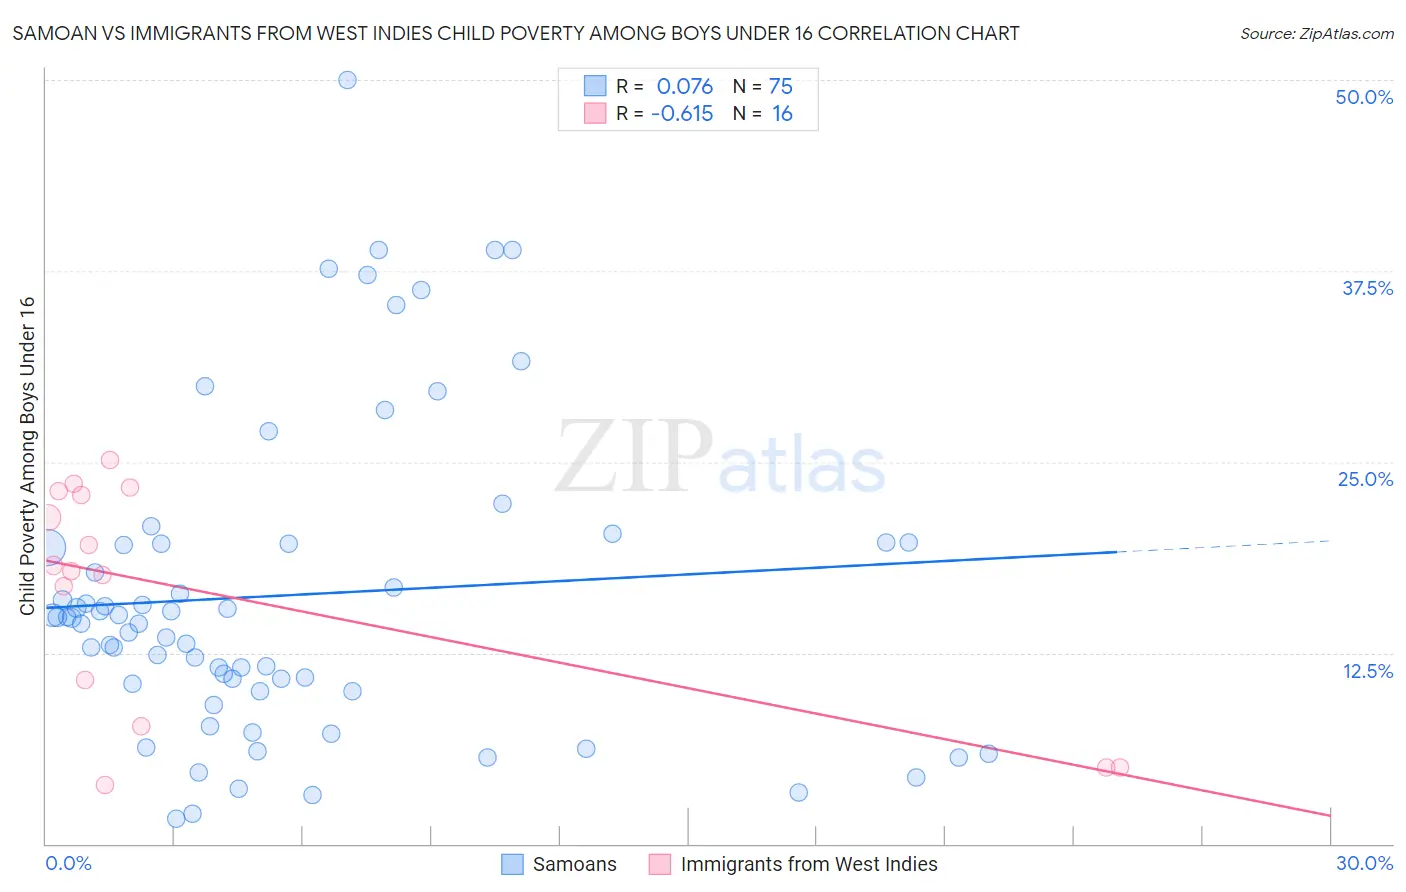
Samoan vs Immigrants from West Indies Child Poverty Among Boys Under 16 Correlation Chart
The statistical analysis conducted on geographies consisting of 223,909,678 people shows a slight positive correlation between the proportion of Samoans and poverty level among boys under the age of 16 in the United States with a correlation coefficient (R) of 0.076 and weighted average of 15.7%. Similarly, the statistical analysis conducted on geographies consisting of 72,283,837 people shows a significant negative correlation between the proportion of Immigrants from West Indies and poverty level among boys under the age of 16 in the United States with a correlation coefficient (R) of -0.615 and weighted average of 20.0%, a difference of 27.4%.
Child Poverty Among Boys Under 16 Correlation Summary
| Measurement | Samoan | Immigrants from West Indies |
| Minimum | 1.7% | 3.9% |
| Maximum | 50.0% | 25.1% |
| Range | 48.3% | 21.2% |
| Mean | 16.3% | 16.3% |
| Median | 14.8% | 18.0% |
| Interquartile 25% (IQ1) | 10.0% | 9.2% |
| Interquartile 75% (IQ3) | 19.7% | 22.9% |
| Interquartile Range (IQR) | 9.7% | 13.8% |
| Standard Deviation (Sample) | 10.3% | 7.4% |
| Standard Deviation (Population) | 10.2% | 7.2% |
Similar Demographics by Child Poverty Among Boys Under 16
Demographics Similar to Samoans by Child Poverty Among Boys Under 16
In terms of child poverty among boys under 16, the demographic groups most similar to Samoans are Immigrants from Peru (15.7%, a difference of 0.060%), Immigrants from Fiji (15.7%, a difference of 0.080%), New Zealander (15.7%, a difference of 0.16%), Immigrants from Hungary (15.7%, a difference of 0.18%), and Venezuelan (15.7%, a difference of 0.22%).
| Demographics | Rating | Rank | Child Poverty Among Boys Under 16 |
| Immigrants | Southern Europe | 86.5 /100 | #138 | Excellent 15.6% |
| Albanians | 86.5 /100 | #139 | Excellent 15.6% |
| Immigrants | Kuwait | 85.6 /100 | #140 | Excellent 15.6% |
| Slavs | 84.5 /100 | #141 | Excellent 15.7% |
| Immigrants | Hungary | 84.1 /100 | #142 | Excellent 15.7% |
| Immigrants | Fiji | 83.6 /100 | #143 | Excellent 15.7% |
| Immigrants | Peru | 83.5 /100 | #144 | Excellent 15.7% |
| Samoans | 83.2 /100 | #145 | Excellent 15.7% |
| New Zealanders | 82.4 /100 | #146 | Excellent 15.7% |
| Venezuelans | 82.1 /100 | #147 | Excellent 15.7% |
| Brazilians | 81.0 /100 | #148 | Excellent 15.8% |
| Slovaks | 80.3 /100 | #149 | Excellent 15.8% |
| Immigrants | Jordan | 80.2 /100 | #150 | Excellent 15.8% |
| Puget Sound Salish | 79.8 /100 | #151 | Good 15.8% |
| Immigrants | Venezuela | 79.5 /100 | #152 | Good 15.8% |
Demographics Similar to Immigrants from West Indies by Child Poverty Among Boys Under 16
In terms of child poverty among boys under 16, the demographic groups most similar to Immigrants from West Indies are Immigrants from Barbados (20.0%, a difference of 0.020%), Subsaharan African (20.0%, a difference of 0.12%), Bangladeshi (20.0%, a difference of 0.13%), Central American (20.1%, a difference of 0.25%), and Jamaican (20.0%, a difference of 0.29%).
| Demographics | Rating | Rank | Child Poverty Among Boys Under 16 |
| Chickasaw | 0.1 /100 | #271 | Tragic 19.8% |
| Immigrants | Ecuador | 0.1 /100 | #272 | Tragic 19.8% |
| Belizeans | 0.1 /100 | #273 | Tragic 19.9% |
| Immigrants | Bangladesh | 0.0 /100 | #274 | Tragic 19.9% |
| Jamaicans | 0.0 /100 | #275 | Tragic 20.0% |
| Sub-Saharan Africans | 0.0 /100 | #276 | Tragic 20.0% |
| Immigrants | Barbados | 0.0 /100 | #277 | Tragic 20.0% |
| Immigrants | West Indies | 0.0 /100 | #278 | Tragic 20.0% |
| Bangladeshis | 0.0 /100 | #279 | Tragic 20.0% |
| Central Americans | 0.0 /100 | #280 | Tragic 20.1% |
| Immigrants | Zaire | 0.0 /100 | #281 | Tragic 20.1% |
| Comanche | 0.0 /100 | #282 | Tragic 20.1% |
| Immigrants | Jamaica | 0.0 /100 | #283 | Tragic 20.1% |
| Barbadians | 0.0 /100 | #284 | Tragic 20.2% |
| Arapaho | 0.0 /100 | #285 | Tragic 20.2% |