Cuban vs Immigrants from Argentina Seniors Poverty Over the Age of 75
COMPARE
Cuban
Immigrants from Argentina
Seniors Poverty Over the Age of 75
Seniors Poverty Over the Age of 75 Comparison
Cubans
Immigrants from Argentina
18.0%
SENIORS POVERTY OVER THE AGE OF 75
0.0/ 100
METRIC RATING
335th/ 347
METRIC RANK
13.7%
SENIORS POVERTY OVER THE AGE OF 75
0.3/ 100
METRIC RATING
252nd/ 347
METRIC RANK
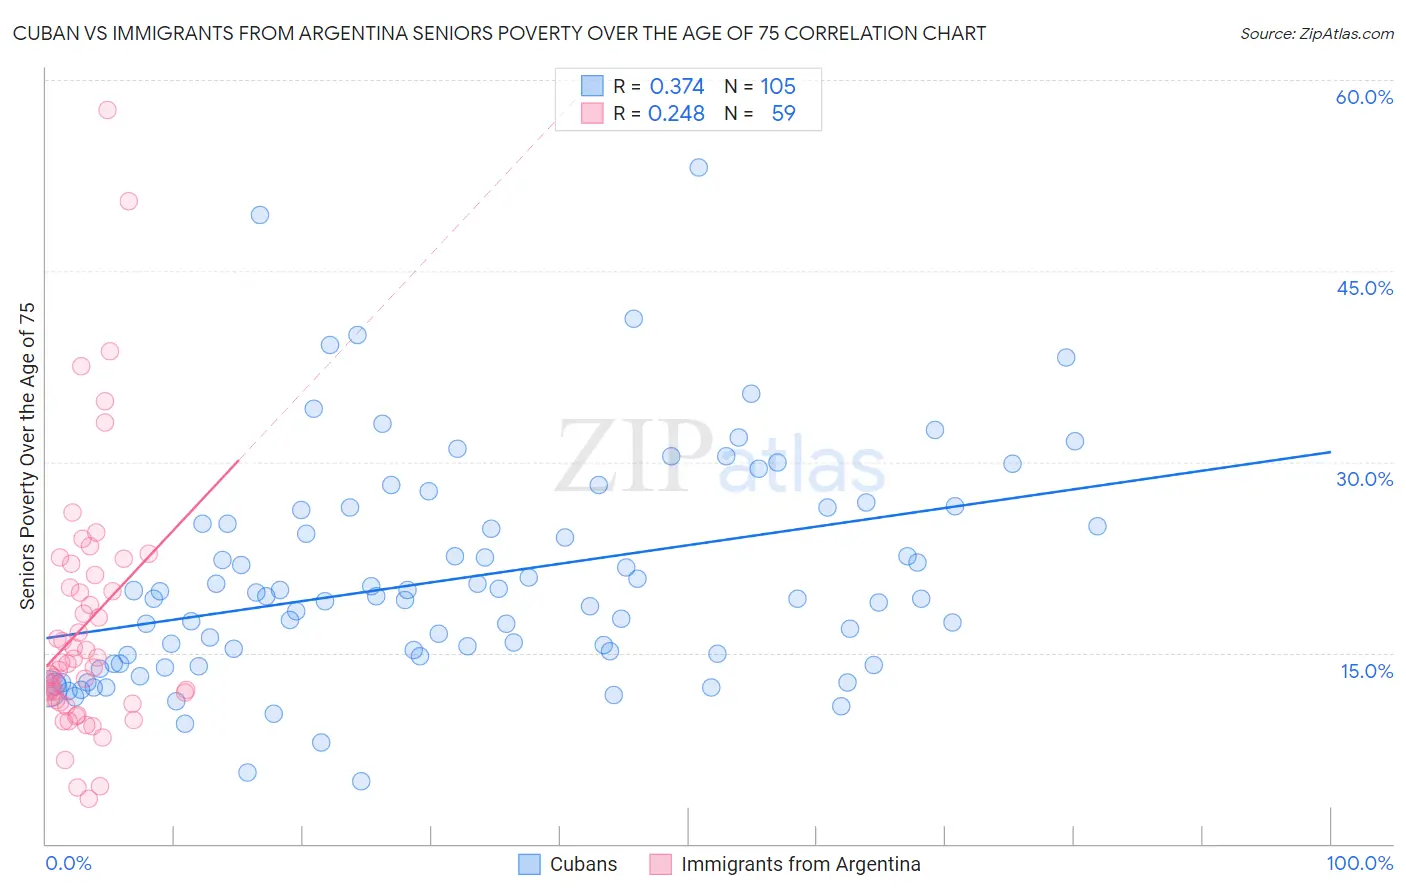
Cuban vs Immigrants from Argentina Seniors Poverty Over the Age of 75 Correlation Chart
The statistical analysis conducted on geographies consisting of 443,347,202 people shows a mild positive correlation between the proportion of Cubans and poverty level among seniors over the age of 75 in the United States with a correlation coefficient (R) of 0.374 and weighted average of 18.0%. Similarly, the statistical analysis conducted on geographies consisting of 262,394,450 people shows a weak positive correlation between the proportion of Immigrants from Argentina and poverty level among seniors over the age of 75 in the United States with a correlation coefficient (R) of 0.248 and weighted average of 13.7%, a difference of 31.4%.
Seniors Poverty Over the Age of 75 Correlation Summary
| Measurement | Cuban | Immigrants from Argentina |
| Minimum | 4.9% | 3.5% |
| Maximum | 53.2% | 57.7% |
| Range | 48.3% | 54.2% |
| Mean | 20.8% | 17.2% |
| Median | 19.2% | 14.2% |
| Interquartile 25% (IQ1) | 14.5% | 11.0% |
| Interquartile 75% (IQ3) | 25.7% | 21.1% |
| Interquartile Range (IQR) | 11.2% | 10.0% |
| Standard Deviation (Sample) | 8.7% | 10.3% |
| Standard Deviation (Population) | 8.7% | 10.2% |
Similar Demographics by Seniors Poverty Over the Age of 75
Demographics Similar to Cubans by Seniors Poverty Over the Age of 75
In terms of seniors poverty over the age of 75, the demographic groups most similar to Cubans are Immigrants from Grenada (17.8%, a difference of 0.59%), Immigrants from Caribbean (18.2%, a difference of 1.6%), Yakama (18.3%, a difference of 2.1%), Immigrants from Nicaragua (17.6%, a difference of 2.1%), and Immigrants from St. Vincent and the Grenadines (17.5%, a difference of 2.6%).
| Demographics | Rating | Rank | Seniors Poverty Over the Age of 75 |
| Cape Verdeans | 0.0 /100 | #328 | Tragic 16.8% |
| Immigrants | Dominica | 0.0 /100 | #329 | Tragic 17.0% |
| British West Indians | 0.0 /100 | #330 | Tragic 17.4% |
| Immigrants | Armenia | 0.0 /100 | #331 | Tragic 17.5% |
| Immigrants | St. Vincent and the Grenadines | 0.0 /100 | #332 | Tragic 17.5% |
| Immigrants | Nicaragua | 0.0 /100 | #333 | Tragic 17.6% |
| Immigrants | Grenada | 0.0 /100 | #334 | Tragic 17.8% |
| Cubans | 0.0 /100 | #335 | Tragic 18.0% |
| Immigrants | Caribbean | 0.0 /100 | #336 | Tragic 18.2% |
| Yakama | 0.0 /100 | #337 | Tragic 18.3% |
| Immigrants | Cabo Verde | 0.0 /100 | #338 | Tragic 18.5% |
| Hopi | 0.0 /100 | #339 | Tragic 18.9% |
| Tohono O'odham | 0.0 /100 | #340 | Tragic 19.1% |
| Navajo | 0.0 /100 | #341 | Tragic 19.4% |
| Dominicans | 0.0 /100 | #342 | Tragic 19.6% |
Demographics Similar to Immigrants from Argentina by Seniors Poverty Over the Age of 75
In terms of seniors poverty over the age of 75, the demographic groups most similar to Immigrants from Argentina are Immigrants from Peru (13.7%, a difference of 0.050%), Immigrants from Spain (13.7%, a difference of 0.22%), Blackfeet (13.7%, a difference of 0.33%), Mexican American Indian (13.6%, a difference of 0.38%), and Immigrants from Albania (13.6%, a difference of 0.39%).
| Demographics | Rating | Rank | Seniors Poverty Over the Age of 75 |
| Uruguayans | 0.5 /100 | #245 | Tragic 13.5% |
| Immigrants | Cambodia | 0.4 /100 | #246 | Tragic 13.6% |
| Immigrants | Ukraine | 0.3 /100 | #247 | Tragic 13.6% |
| Africans | 0.3 /100 | #248 | Tragic 13.6% |
| Immigrants | Albania | 0.3 /100 | #249 | Tragic 13.6% |
| Mexican American Indians | 0.3 /100 | #250 | Tragic 13.6% |
| Immigrants | Peru | 0.3 /100 | #251 | Tragic 13.7% |
| Immigrants | Argentina | 0.3 /100 | #252 | Tragic 13.7% |
| Immigrants | Spain | 0.2 /100 | #253 | Tragic 13.7% |
| Blackfeet | 0.2 /100 | #254 | Tragic 13.7% |
| Immigrants | Belarus | 0.2 /100 | #255 | Tragic 13.8% |
| Inupiat | 0.1 /100 | #256 | Tragic 13.8% |
| Immigrants | Western Africa | 0.1 /100 | #257 | Tragic 13.9% |
| Immigrants | Panama | 0.1 /100 | #258 | Tragic 13.9% |
| Immigrants | Portugal | 0.1 /100 | #259 | Tragic 13.9% |