Cuban vs Argentinean Single Male Poverty
COMPARE
Cuban
Argentinean
Single Male Poverty
Single Male Poverty Comparison
Cubans
Argentineans
12.6%
SINGLE MALE POVERTY
79.9/ 100
METRIC RATING
139th/ 347
METRIC RANK
11.9%
SINGLE MALE POVERTY
99.5/ 100
METRIC RATING
73rd/ 347
METRIC RANK
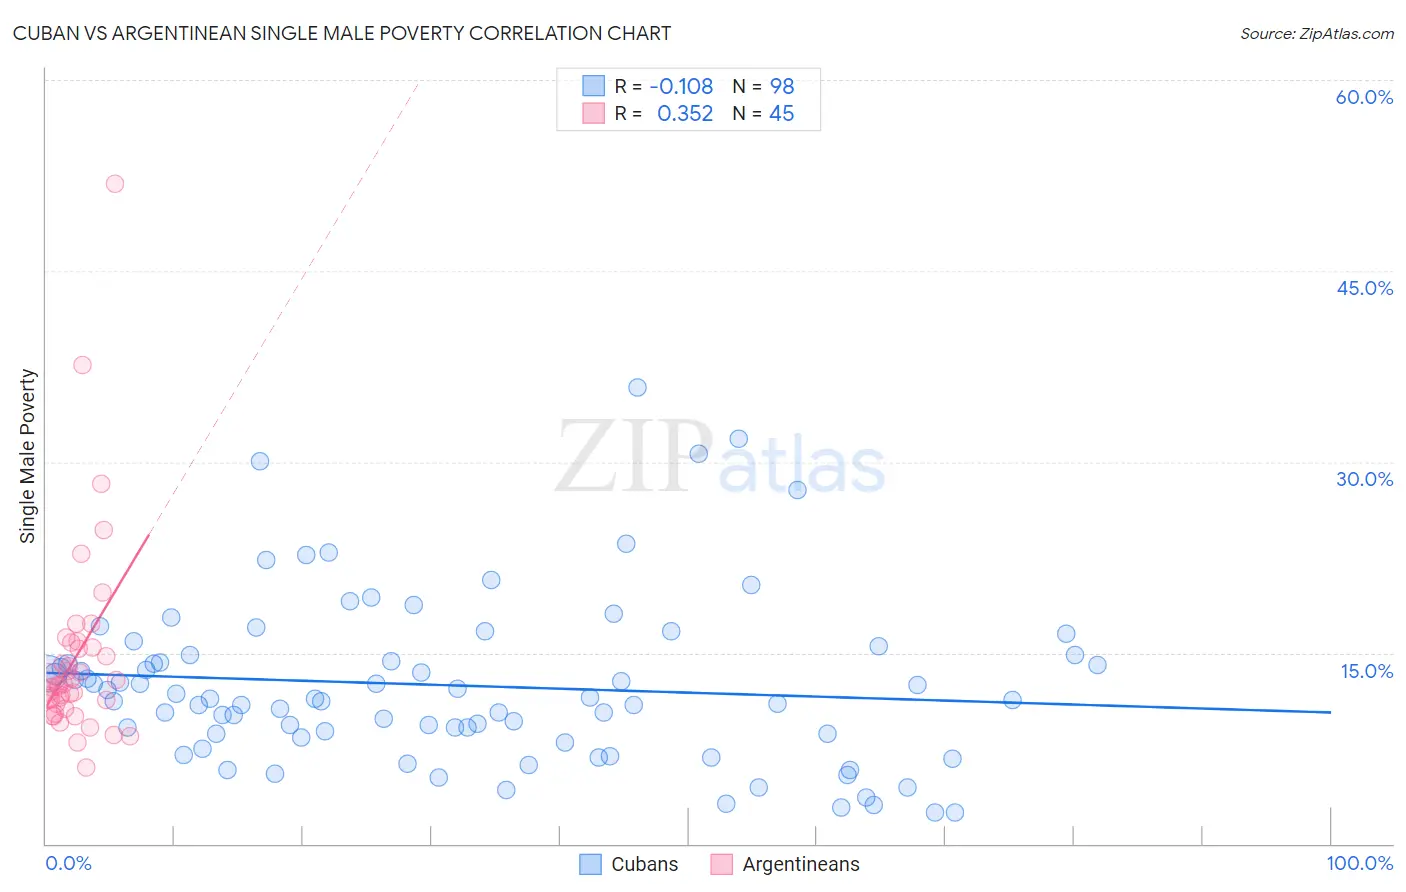
Cuban vs Argentinean Single Male Poverty Correlation Chart
The statistical analysis conducted on geographies consisting of 395,594,477 people shows a poor negative correlation between the proportion of Cubans and poverty level among single males in the United States with a correlation coefficient (R) of -0.108 and weighted average of 12.6%. Similarly, the statistical analysis conducted on geographies consisting of 268,813,546 people shows a mild positive correlation between the proportion of Argentineans and poverty level among single males in the United States with a correlation coefficient (R) of 0.352 and weighted average of 11.9%, a difference of 5.5%.
Single Male Poverty Correlation Summary
| Measurement | Cuban | Argentinean |
| Minimum | 2.4% | 6.0% |
| Maximum | 35.9% | 51.8% |
| Range | 33.4% | 45.8% |
| Mean | 12.4% | 14.7% |
| Median | 11.4% | 12.4% |
| Interquartile 25% (IQ1) | 8.6% | 10.8% |
| Interquartile 75% (IQ3) | 14.8% | 15.6% |
| Interquartile Range (IQR) | 6.2% | 4.8% |
| Standard Deviation (Sample) | 6.5% | 7.9% |
| Standard Deviation (Population) | 6.5% | 7.9% |
Similar Demographics by Single Male Poverty
Demographics Similar to Cubans by Single Male Poverty
In terms of single male poverty, the demographic groups most similar to Cubans are Immigrants from El Salvador (12.6%, a difference of 0.010%), Ukrainian (12.6%, a difference of 0.070%), Immigrants from Zimbabwe (12.6%, a difference of 0.15%), Immigrants from Costa Rica (12.5%, a difference of 0.18%), and Immigrants from Austria (12.5%, a difference of 0.18%).
| Demographics | Rating | Rank | Single Male Poverty |
| Salvadorans | 83.7 /100 | #132 | Excellent 12.5% |
| Immigrants | Western Asia | 83.4 /100 | #133 | Excellent 12.5% |
| Immigrants | Ecuador | 82.1 /100 | #134 | Excellent 12.5% |
| Immigrants | Costa Rica | 81.9 /100 | #135 | Excellent 12.5% |
| Immigrants | Austria | 81.9 /100 | #136 | Excellent 12.5% |
| Ukrainians | 80.7 /100 | #137 | Excellent 12.6% |
| Immigrants | El Salvador | 80.0 /100 | #138 | Excellent 12.6% |
| Cubans | 79.9 /100 | #139 | Good 12.6% |
| Immigrants | Zimbabwe | 78.0 /100 | #140 | Good 12.6% |
| Okinawans | 75.9 /100 | #141 | Good 12.6% |
| Immigrants | Uganda | 75.9 /100 | #142 | Good 12.6% |
| Immigrants | France | 75.8 /100 | #143 | Good 12.6% |
| Hawaiians | 75.1 /100 | #144 | Good 12.6% |
| Immigrants | Lebanon | 75.0 /100 | #145 | Good 12.6% |
| Native Hawaiians | 75.0 /100 | #146 | Good 12.6% |
Demographics Similar to Argentineans by Single Male Poverty
In terms of single male poverty, the demographic groups most similar to Argentineans are Chilean (11.9%, a difference of 0.060%), Immigrants from Argentina (11.9%, a difference of 0.13%), Uruguayan (11.9%, a difference of 0.25%), Immigrants from Northern Africa (11.9%, a difference of 0.27%), and Immigrants from Greece (11.9%, a difference of 0.31%).
| Demographics | Rating | Rank | Single Male Poverty |
| Immigrants | Uruguay | 99.6 /100 | #66 | Exceptional 11.9% |
| Immigrants | Ukraine | 99.6 /100 | #67 | Exceptional 11.9% |
| Immigrants | Croatia | 99.6 /100 | #68 | Exceptional 11.9% |
| Immigrants | Russia | 99.6 /100 | #69 | Exceptional 11.9% |
| Immigrants | Nepal | 99.6 /100 | #70 | Exceptional 11.9% |
| Immigrants | Greece | 99.6 /100 | #71 | Exceptional 11.9% |
| Immigrants | Argentina | 99.5 /100 | #72 | Exceptional 11.9% |
| Argentineans | 99.5 /100 | #73 | Exceptional 11.9% |
| Chileans | 99.5 /100 | #74 | Exceptional 11.9% |
| Uruguayans | 99.4 /100 | #75 | Exceptional 11.9% |
| Immigrants | Northern Africa | 99.4 /100 | #76 | Exceptional 11.9% |
| Immigrants | Malaysia | 99.2 /100 | #77 | Exceptional 12.0% |
| Immigrants | Venezuela | 99.1 /100 | #78 | Exceptional 12.0% |
| Immigrants | Belgium | 99.0 /100 | #79 | Exceptional 12.0% |
| Armenians | 98.7 /100 | #80 | Exceptional 12.1% |