Cuban vs Ugandan Child Poverty Among Girls Under 16
COMPARE
Cuban
Ugandan
Child Poverty Among Girls Under 16
Child Poverty Among Girls Under 16 Comparison
Cubans
Ugandans
18.0%
CHILD POVERTY AMONG GIRLS UNDER 16
4.1/ 100
METRIC RATING
220th/ 347
METRIC RANK
17.2%
CHILD POVERTY AMONG GIRLS UNDER 16
17.5/ 100
METRIC RATING
203rd/ 347
METRIC RANK
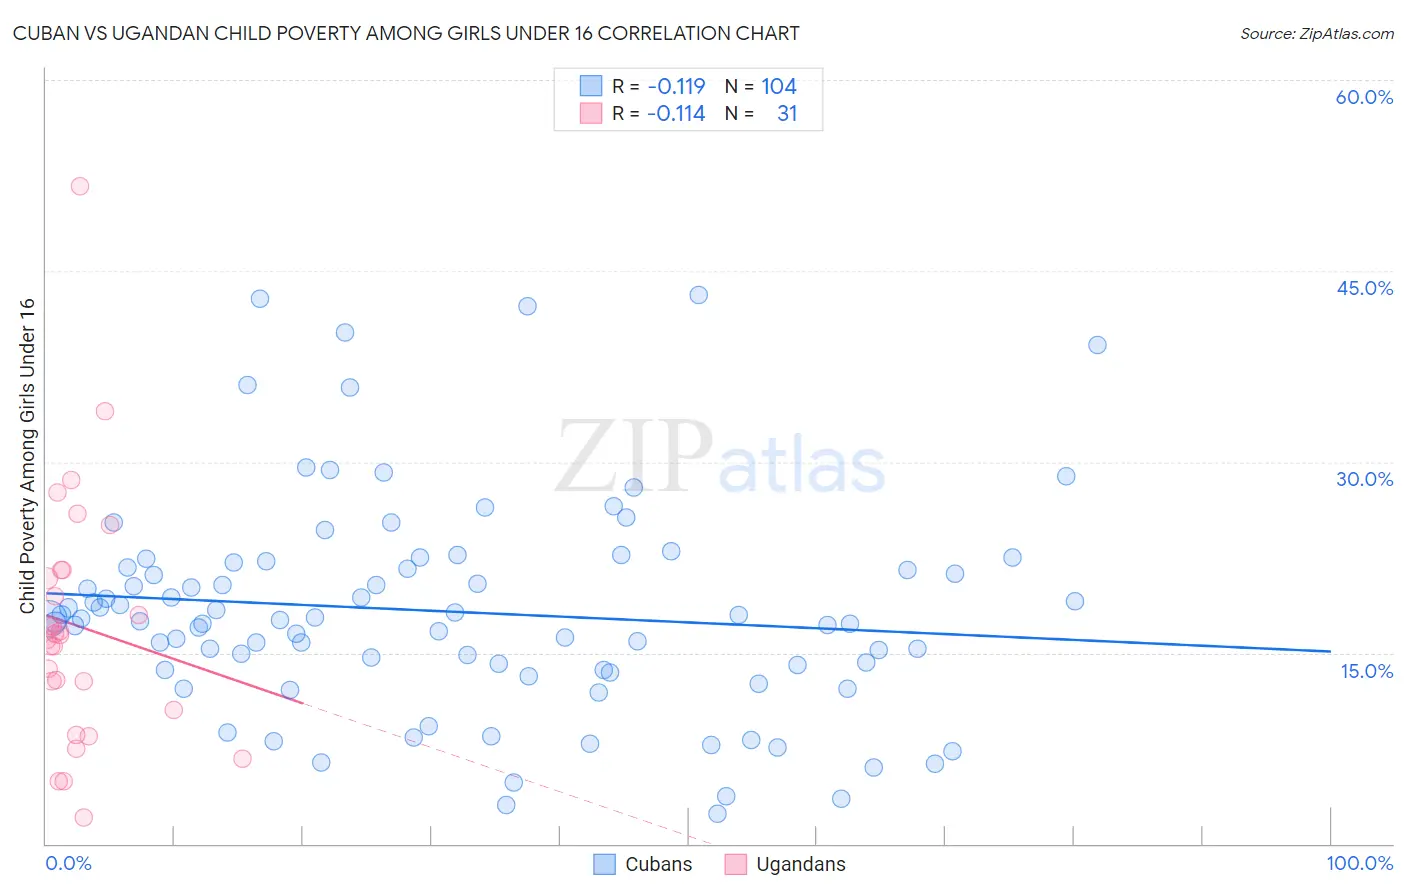
Cuban vs Ugandan Child Poverty Among Girls Under 16 Correlation Chart
The statistical analysis conducted on geographies consisting of 440,192,797 people shows a poor negative correlation between the proportion of Cubans and poverty level among girls under the age of 16 in the United States with a correlation coefficient (R) of -0.119 and weighted average of 18.0%. Similarly, the statistical analysis conducted on geographies consisting of 93,523,032 people shows a poor negative correlation between the proportion of Ugandans and poverty level among girls under the age of 16 in the United States with a correlation coefficient (R) of -0.114 and weighted average of 17.2%, a difference of 4.4%.
Child Poverty Among Girls Under 16 Correlation Summary
| Measurement | Cuban | Ugandan |
| Minimum | 2.3% | 2.1% |
| Maximum | 43.1% | 51.6% |
| Range | 40.8% | 49.5% |
| Mean | 18.2% | 17.1% |
| Median | 17.6% | 16.4% |
| Interquartile 25% (IQ1) | 13.7% | 10.5% |
| Interquartile 75% (IQ3) | 21.9% | 21.5% |
| Interquartile Range (IQR) | 8.3% | 10.9% |
| Standard Deviation (Sample) | 8.5% | 9.8% |
| Standard Deviation (Population) | 8.5% | 9.7% |
Demographics Similar to Cubans and Ugandans by Child Poverty Among Girls Under 16
In terms of child poverty among girls under 16, the demographic groups most similar to Cubans are Immigrants from Panama (17.9%, a difference of 0.38%), Immigrants from Micronesia (18.0%, a difference of 0.43%), Alaska Native (17.8%, a difference of 0.62%), Japanese (17.8%, a difference of 0.72%), and Moroccan (17.8%, a difference of 0.80%). Similarly, the demographic groups most similar to Ugandans are Immigrants from Sierra Leone (17.2%, a difference of 0.010%), Immigrants from Kenya (17.2%, a difference of 0.060%), Iraqi (17.4%, a difference of 0.97%), Immigrants from Cameroon (17.4%, a difference of 1.1%), and Delaware (17.4%, a difference of 1.3%).
| Demographics | Rating | Rank | Child Poverty Among Girls Under 16 |
| Immigrants | Kenya | 17.8 /100 | #201 | Poor 17.2% |
| Immigrants | Sierra Leone | 17.6 /100 | #202 | Poor 17.2% |
| Ugandans | 17.5 /100 | #203 | Poor 17.2% |
| Iraqis | 13.0 /100 | #204 | Poor 17.4% |
| Immigrants | Cameroon | 12.6 /100 | #205 | Poor 17.4% |
| Delaware | 11.5 /100 | #206 | Poor 17.4% |
| Hmong | 10.6 /100 | #207 | Poor 17.5% |
| Sierra Leoneans | 8.9 /100 | #208 | Tragic 17.6% |
| Panamanians | 8.7 /100 | #209 | Tragic 17.6% |
| Immigrants | Immigrants | 7.3 /100 | #210 | Tragic 17.7% |
| Immigrants | Eastern Africa | 6.4 /100 | #211 | Tragic 17.7% |
| Immigrants | Thailand | 6.3 /100 | #212 | Tragic 17.7% |
| Pennsylvania Germans | 5.7 /100 | #213 | Tragic 17.8% |
| Malaysians | 5.7 /100 | #214 | Tragic 17.8% |
| German Russians | 5.7 /100 | #215 | Tragic 17.8% |
| Moroccans | 5.5 /100 | #216 | Tragic 17.8% |
| Japanese | 5.3 /100 | #217 | Tragic 17.8% |
| Alaska Natives | 5.2 /100 | #218 | Tragic 17.8% |
| Immigrants | Panama | 4.7 /100 | #219 | Tragic 17.9% |
| Cubans | 4.1 /100 | #220 | Tragic 18.0% |
| Immigrants | Micronesia | 3.5 /100 | #221 | Tragic 18.0% |