Crow vs Brazilian Seniors Poverty Over the Age of 65
COMPARE
Crow
Brazilian
Seniors Poverty Over the Age of 65
Seniors Poverty Over the Age of 65 Comparison
Crow
Brazilians
15.2%
SENIORS POVERTY OVER THE AGE OF 65
0.0/ 100
METRIC RATING
327th/ 347
METRIC RANK
11.3%
SENIORS POVERTY OVER THE AGE OF 65
15.4/ 100
METRIC RATING
205th/ 347
METRIC RANK
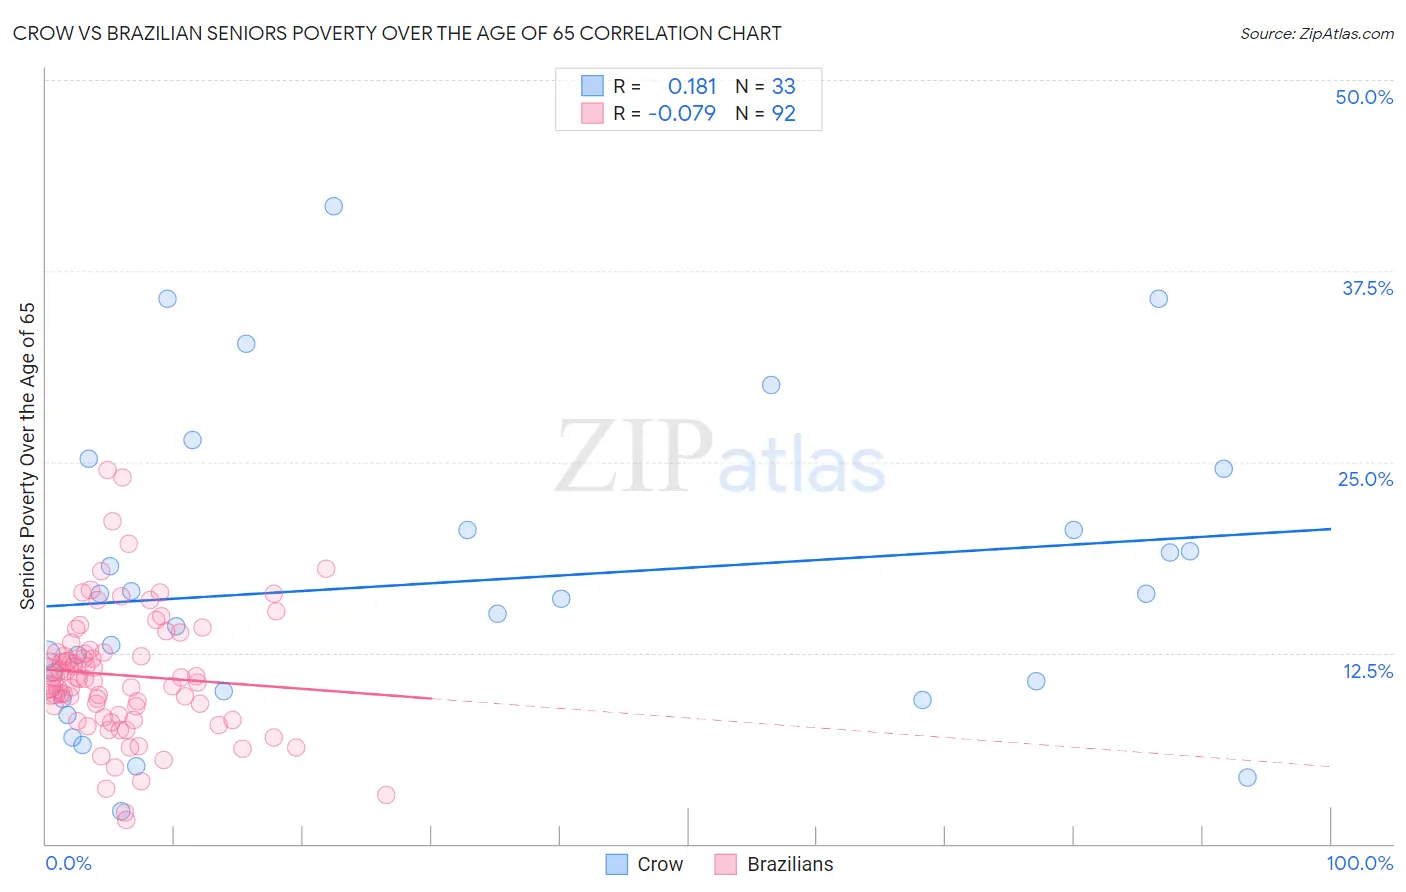
Crow vs Brazilian Seniors Poverty Over the Age of 65 Correlation Chart
The statistical analysis conducted on geographies consisting of 59,133,191 people shows a poor positive correlation between the proportion of Crow and poverty level among seniors over the age of 65 in the United States with a correlation coefficient (R) of 0.181 and weighted average of 15.2%. Similarly, the statistical analysis conducted on geographies consisting of 322,811,163 people shows a slight negative correlation between the proportion of Brazilians and poverty level among seniors over the age of 65 in the United States with a correlation coefficient (R) of -0.079 and weighted average of 11.3%, a difference of 34.1%.
Seniors Poverty Over the Age of 65 Correlation Summary
| Measurement | Crow | Brazilian |
| Minimum | 2.1% | 1.6% |
| Maximum | 41.7% | 24.5% |
| Range | 39.6% | 22.9% |
| Mean | 17.2% | 11.0% |
| Median | 16.1% | 10.8% |
| Interquartile 25% (IQ1) | 9.8% | 8.3% |
| Interquartile 75% (IQ3) | 22.6% | 12.6% |
| Interquartile Range (IQR) | 12.8% | 4.3% |
| Standard Deviation (Sample) | 9.8% | 4.2% |
| Standard Deviation (Population) | 9.7% | 4.2% |
Similar Demographics by Seniors Poverty Over the Age of 65
Demographics Similar to Crow by Seniors Poverty Over the Age of 65
In terms of seniors poverty over the age of 65, the demographic groups most similar to Crow are Immigrants from Armenia (15.2%, a difference of 0.25%), Sioux (15.3%, a difference of 0.54%), Central American Indian (15.1%, a difference of 0.86%), Nicaraguan (15.0%, a difference of 1.5%), and Immigrants from Dominica (15.5%, a difference of 1.6%).
| Demographics | Rating | Rank | Seniors Poverty Over the Age of 65 |
| Immigrants | Haiti | 0.0 /100 | #320 | Tragic 14.7% |
| Houma | 0.0 /100 | #321 | Tragic 14.7% |
| Immigrants | Barbados | 0.0 /100 | #322 | Tragic 14.8% |
| Yakama | 0.0 /100 | #323 | Tragic 14.8% |
| Nicaraguans | 0.0 /100 | #324 | Tragic 15.0% |
| Central American Indians | 0.0 /100 | #325 | Tragic 15.1% |
| Immigrants | Armenia | 0.0 /100 | #326 | Tragic 15.2% |
| Crow | 0.0 /100 | #327 | Tragic 15.2% |
| Sioux | 0.0 /100 | #328 | Tragic 15.3% |
| Immigrants | Dominica | 0.0 /100 | #329 | Tragic 15.5% |
| Immigrants | St. Vincent and the Grenadines | 0.0 /100 | #330 | Tragic 15.5% |
| British West Indians | 0.0 /100 | #331 | Tragic 15.6% |
| Immigrants | Grenada | 0.0 /100 | #332 | Tragic 15.8% |
| Immigrants | Yemen | 0.0 /100 | #333 | Tragic 15.9% |
| Immigrants | Nicaragua | 0.0 /100 | #334 | Tragic 15.9% |
Demographics Similar to Brazilians by Seniors Poverty Over the Age of 65
In terms of seniors poverty over the age of 65, the demographic groups most similar to Brazilians are Choctaw (11.4%, a difference of 0.14%), Israeli (11.3%, a difference of 0.18%), Immigrants from Zaire (11.3%, a difference of 0.24%), Costa Rican (11.3%, a difference of 0.25%), and Immigrants from Western Asia (11.4%, a difference of 0.31%).
| Demographics | Rating | Rank | Seniors Poverty Over the Age of 65 |
| Immigrants | Burma/Myanmar | 21.3 /100 | #198 | Fair 11.3% |
| Immigrants | Israel | 20.3 /100 | #199 | Fair 11.3% |
| Alsatians | 20.1 /100 | #200 | Fair 11.3% |
| Immigrants | Brazil | 17.8 /100 | #201 | Poor 11.3% |
| Costa Ricans | 17.0 /100 | #202 | Poor 11.3% |
| Immigrants | Zaire | 16.9 /100 | #203 | Poor 11.3% |
| Israelis | 16.5 /100 | #204 | Poor 11.3% |
| Brazilians | 15.4 /100 | #205 | Poor 11.3% |
| Choctaw | 14.5 /100 | #206 | Poor 11.4% |
| Immigrants | Western Asia | 13.6 /100 | #207 | Poor 11.4% |
| South American Indians | 11.7 /100 | #208 | Poor 11.4% |
| Paraguayans | 11.3 /100 | #209 | Poor 11.4% |
| Ugandans | 11.2 /100 | #210 | Poor 11.4% |
| Indonesians | 10.4 /100 | #211 | Poor 11.5% |
| Immigrants | China | 9.5 /100 | #212 | Tragic 11.5% |