Israeli vs Norwegian Single Father Poverty
COMPARE
Israeli
Norwegian
Single Father Poverty
Single Father Poverty Comparison
Israelis
Norwegians
16.8%
SINGLE FATHER POVERTY
4.6/ 100
METRIC RATING
229th/ 347
METRIC RANK
15.9%
SINGLE FATHER POVERTY
90.2/ 100
METRIC RATING
130th/ 347
METRIC RANK
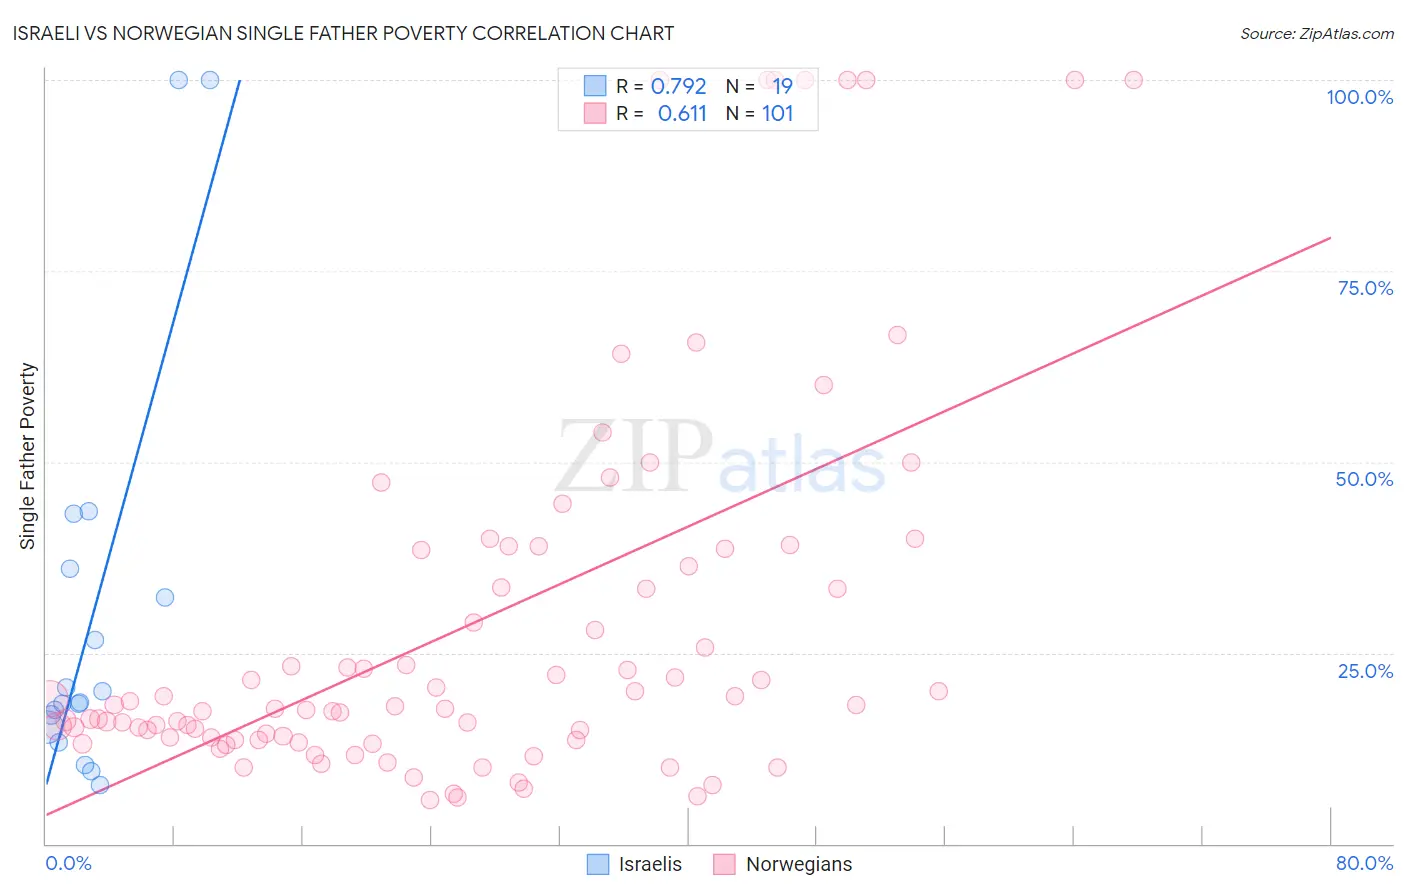
Israeli vs Norwegian Single Father Poverty Correlation Chart
The statistical analysis conducted on geographies consisting of 176,564,274 people shows a strong positive correlation between the proportion of Israelis and poverty level among single fathers in the United States with a correlation coefficient (R) of 0.792 and weighted average of 16.8%. Similarly, the statistical analysis conducted on geographies consisting of 388,337,291 people shows a significant positive correlation between the proportion of Norwegians and poverty level among single fathers in the United States with a correlation coefficient (R) of 0.611 and weighted average of 15.9%, a difference of 5.9%.
Single Father Poverty Correlation Summary
| Measurement | Israeli | Norwegian |
| Minimum | 7.8% | 5.8% |
| Maximum | 100.0% | 100.0% |
| Range | 92.2% | 94.2% |
| Mean | 29.9% | 28.6% |
| Median | 18.5% | 17.9% |
| Interquartile 25% (IQ1) | 15.2% | 13.8% |
| Interquartile 75% (IQ3) | 35.9% | 37.4% |
| Interquartile Range (IQR) | 20.7% | 23.6% |
| Standard Deviation (Sample) | 26.8% | 25.1% |
| Standard Deviation (Population) | 26.1% | 25.0% |
Similar Demographics by Single Father Poverty
Demographics Similar to Israelis by Single Father Poverty
In terms of single father poverty, the demographic groups most similar to Israelis are Immigrants from Trinidad and Tobago (16.8%, a difference of 0.030%), Belgian (16.8%, a difference of 0.16%), British (16.8%, a difference of 0.22%), Spanish American (16.9%, a difference of 0.24%), and Immigrants from Grenada (16.9%, a difference of 0.26%).
| Demographics | Rating | Rank | Single Father Poverty |
| Immigrants | Spain | 8.0 /100 | #222 | Tragic 16.7% |
| Immigrants | Austria | 7.0 /100 | #223 | Tragic 16.8% |
| Immigrants | Norway | 6.5 /100 | #224 | Tragic 16.8% |
| Menominee | 6.4 /100 | #225 | Tragic 16.8% |
| Hispanics or Latinos | 6.1 /100 | #226 | Tragic 16.8% |
| British | 5.6 /100 | #227 | Tragic 16.8% |
| Belgians | 5.3 /100 | #228 | Tragic 16.8% |
| Israelis | 4.6 /100 | #229 | Tragic 16.8% |
| Immigrants | Trinidad and Tobago | 4.5 /100 | #230 | Tragic 16.8% |
| Spanish Americans | 3.7 /100 | #231 | Tragic 16.9% |
| Immigrants | Grenada | 3.7 /100 | #232 | Tragic 16.9% |
| Senegalese | 3.2 /100 | #233 | Tragic 16.9% |
| Marshallese | 3.1 /100 | #234 | Tragic 16.9% |
| Immigrants | Western Europe | 2.9 /100 | #235 | Tragic 16.9% |
| Immigrants | Germany | 2.9 /100 | #236 | Tragic 16.9% |
Demographics Similar to Norwegians by Single Father Poverty
In terms of single father poverty, the demographic groups most similar to Norwegians are Nicaraguan (15.9%, a difference of 0.0%), Immigrants from Portugal (15.9%, a difference of 0.060%), Immigrants from Nigeria (15.9%, a difference of 0.080%), Immigrants from West Indies (15.9%, a difference of 0.080%), and Immigrants from Syria (15.9%, a difference of 0.080%).
| Demographics | Rating | Rank | Single Father Poverty |
| Palestinians | 91.3 /100 | #123 | Exceptional 15.9% |
| Immigrants | Panama | 91.3 /100 | #124 | Exceptional 15.9% |
| Iraqis | 91.2 /100 | #125 | Exceptional 15.9% |
| Hmong | 91.1 /100 | #126 | Exceptional 15.9% |
| Immigrants | Liberia | 91.1 /100 | #127 | Exceptional 15.9% |
| Immigrants | Nigeria | 90.8 /100 | #128 | Exceptional 15.9% |
| Immigrants | West Indies | 90.8 /100 | #129 | Exceptional 15.9% |
| Norwegians | 90.2 /100 | #130 | Exceptional 15.9% |
| Nicaraguans | 90.1 /100 | #131 | Exceptional 15.9% |
| Immigrants | Portugal | 89.7 /100 | #132 | Excellent 15.9% |
| Immigrants | Syria | 89.5 /100 | #133 | Excellent 15.9% |
| Immigrants | South America | 88.5 /100 | #134 | Excellent 15.9% |
| Immigrants | Sri Lanka | 88.2 /100 | #135 | Excellent 15.9% |
| Cypriots | 87.5 /100 | #136 | Excellent 15.9% |
| Immigrants | Azores | 87.2 /100 | #137 | Excellent 15.9% |