Cree vs Guatemalan Receiving Food Stamps
COMPARE
Cree
Guatemalan
Receiving Food Stamps
Receiving Food Stamps Comparison
Cree
Guatemalans
13.7%
RECEIVING FOOD STAMPS
0.8/ 100
METRIC RATING
246th/ 347
METRIC RANK
14.4%
RECEIVING FOOD STAMPS
0.1/ 100
METRIC RATING
268th/ 347
METRIC RANK
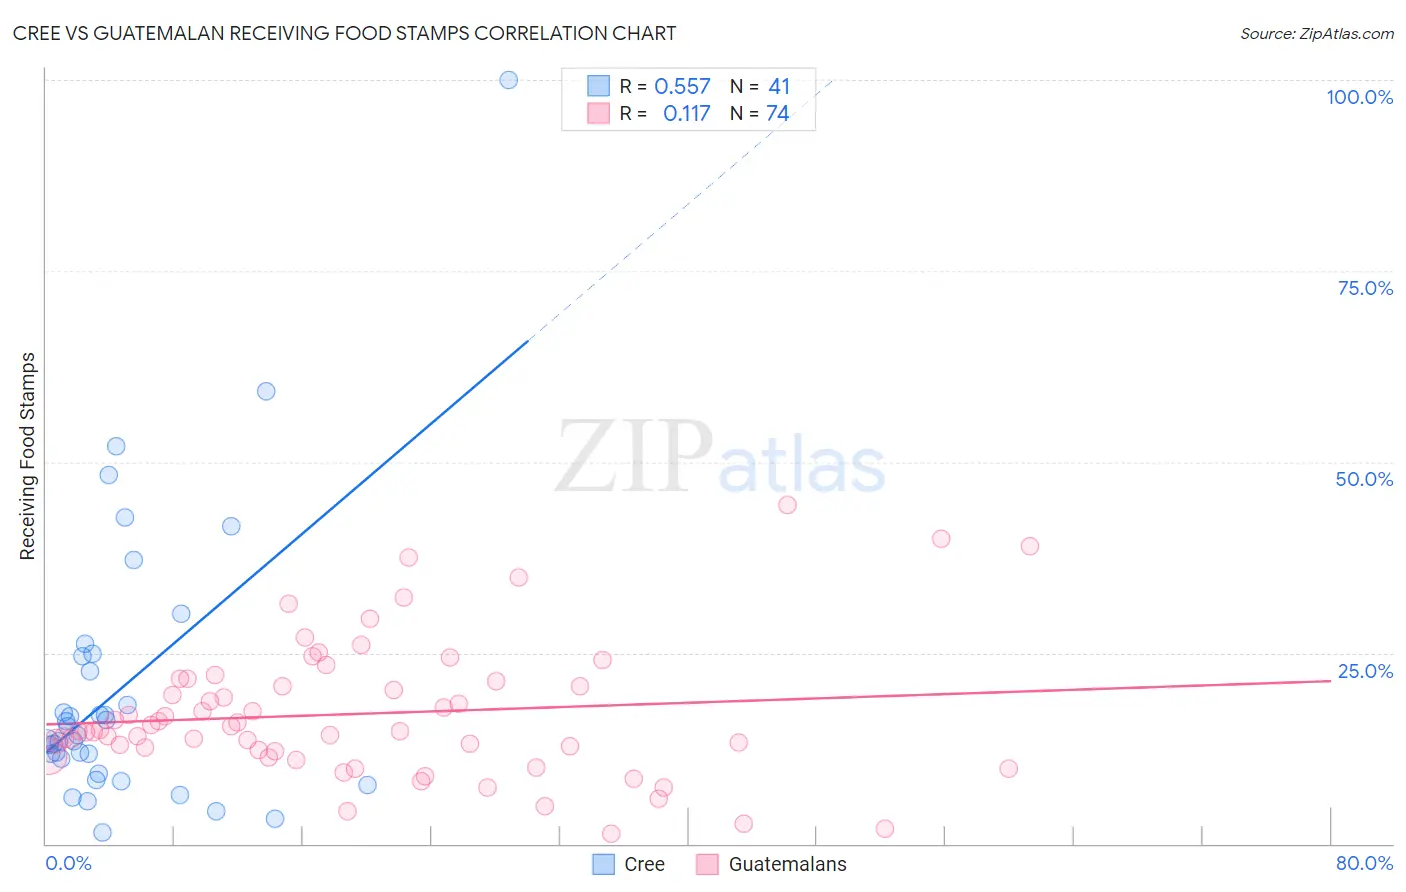
Cree vs Guatemalan Receiving Food Stamps Correlation Chart
The statistical analysis conducted on geographies consisting of 76,186,239 people shows a substantial positive correlation between the proportion of Cree and percentage of population receiving government assistance and/or food stamps in the United States with a correlation coefficient (R) of 0.557 and weighted average of 13.7%. Similarly, the statistical analysis conducted on geographies consisting of 408,642,708 people shows a poor positive correlation between the proportion of Guatemalans and percentage of population receiving government assistance and/or food stamps in the United States with a correlation coefficient (R) of 0.117 and weighted average of 14.4%, a difference of 5.1%.
Receiving Food Stamps Correlation Summary
| Measurement | Cree | Guatemalan |
| Minimum | 1.5% | 1.3% |
| Maximum | 100.0% | 44.4% |
| Range | 98.5% | 43.1% |
| Mean | 20.6% | 17.0% |
| Median | 14.2% | 14.8% |
| Interquartile 25% (IQ1) | 10.1% | 12.2% |
| Interquartile 75% (IQ3) | 24.7% | 21.2% |
| Interquartile Range (IQR) | 14.6% | 9.0% |
| Standard Deviation (Sample) | 18.6% | 8.9% |
| Standard Deviation (Population) | 18.4% | 8.8% |
Similar Demographics by Receiving Food Stamps
Demographics Similar to Cree by Receiving Food Stamps
In terms of receiving food stamps, the demographic groups most similar to Cree are Immigrants from Somalia (13.7%, a difference of 0.24%), Mexican American Indian (13.8%, a difference of 0.27%), Cajun (13.7%, a difference of 0.28%), Immigrants from Laos (13.8%, a difference of 0.36%), and Somali (13.7%, a difference of 0.44%).
| Demographics | Rating | Rank | Receiving Food Stamps |
| Immigrants | Micronesia | 1.3 /100 | #239 | Tragic 13.5% |
| Iroquois | 1.2 /100 | #240 | Tragic 13.5% |
| Choctaw | 1.0 /100 | #241 | Tragic 13.6% |
| Immigrants | Panama | 1.0 /100 | #242 | Tragic 13.6% |
| Somalis | 0.9 /100 | #243 | Tragic 13.7% |
| Cajuns | 0.9 /100 | #244 | Tragic 13.7% |
| Immigrants | Somalia | 0.9 /100 | #245 | Tragic 13.7% |
| Cree | 0.8 /100 | #246 | Tragic 13.7% |
| Mexican American Indians | 0.7 /100 | #247 | Tragic 13.8% |
| Immigrants | Laos | 0.7 /100 | #248 | Tragic 13.8% |
| Indonesians | 0.6 /100 | #249 | Tragic 13.9% |
| Immigrants | Cambodia | 0.5 /100 | #250 | Tragic 13.9% |
| Yaqui | 0.5 /100 | #251 | Tragic 13.9% |
| Ghanaians | 0.5 /100 | #252 | Tragic 14.0% |
| Spanish Americans | 0.4 /100 | #253 | Tragic 14.0% |
Demographics Similar to Guatemalans by Receiving Food Stamps
In terms of receiving food stamps, the demographic groups most similar to Guatemalans are Dutch West Indian (14.3%, a difference of 0.66%), Cheyenne (14.3%, a difference of 0.88%), Blackfeet (14.3%, a difference of 0.96%), Immigrants from Uzbekistan (14.3%, a difference of 1.0%), and Paiute (14.3%, a difference of 1.1%).
| Demographics | Rating | Rank | Receiving Food Stamps |
| Immigrants | Congo | 0.3 /100 | #261 | Tragic 14.1% |
| Paiute | 0.2 /100 | #262 | Tragic 14.3% |
| Immigrants | Portugal | 0.2 /100 | #263 | Tragic 14.3% |
| Immigrants | Uzbekistan | 0.2 /100 | #264 | Tragic 14.3% |
| Blackfeet | 0.2 /100 | #265 | Tragic 14.3% |
| Cheyenne | 0.2 /100 | #266 | Tragic 14.3% |
| Dutch West Indians | 0.2 /100 | #267 | Tragic 14.3% |
| Guatemalans | 0.1 /100 | #268 | Tragic 14.4% |
| Nepalese | 0.1 /100 | #269 | Tragic 14.6% |
| Mexicans | 0.1 /100 | #270 | Tragic 14.6% |
| Immigrants | Guatemala | 0.1 /100 | #271 | Tragic 14.6% |
| Chippewa | 0.1 /100 | #272 | Tragic 14.7% |
| Alaskan Athabascans | 0.1 /100 | #273 | Tragic 14.7% |
| Immigrants | Western Africa | 0.1 /100 | #274 | Tragic 14.7% |
| Ute | 0.1 /100 | #275 | Tragic 14.7% |