Cree vs Croatian 12th Grade, No Diploma
COMPARE
Cree
Croatian
12th Grade, No Diploma
12th Grade, No Diploma Comparison
Cree
Croatians
91.2%
12TH GRADE, NO DIPLOMA
57.0/ 100
METRIC RATING
168th/ 347
METRIC RANK
93.5%
12TH GRADE, NO DIPLOMA
100.0/ 100
METRIC RATING
10th/ 347
METRIC RANK
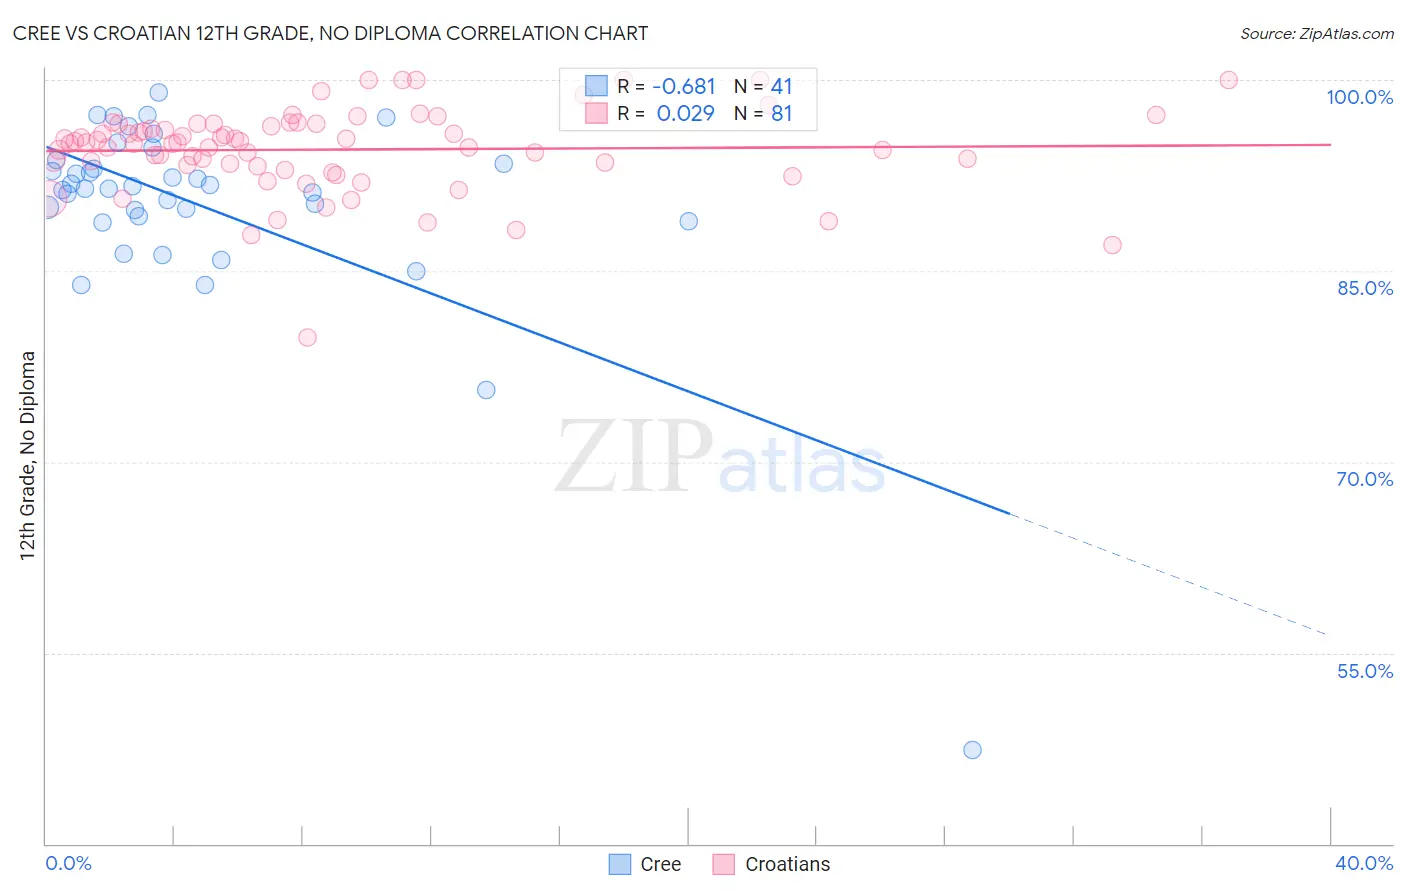
Cree vs Croatian 12th Grade, No Diploma Correlation Chart
The statistical analysis conducted on geographies consisting of 76,211,744 people shows a significant negative correlation between the proportion of Cree and percentage of population with at least 12th grade (no diploma) education in the United States with a correlation coefficient (R) of -0.681 and weighted average of 91.2%. Similarly, the statistical analysis conducted on geographies consisting of 375,733,787 people shows no correlation between the proportion of Croatians and percentage of population with at least 12th grade (no diploma) education in the United States with a correlation coefficient (R) of 0.029 and weighted average of 93.5%, a difference of 2.5%.
12th Grade, No Diploma Correlation Summary
| Measurement | Cree | Croatian |
| Minimum | 47.4% | 79.8% |
| Maximum | 99.0% | 100.0% |
| Range | 51.6% | 20.2% |
| Mean | 90.2% | 94.5% |
| Median | 91.5% | 95.0% |
| Interquartile 25% (IQ1) | 89.1% | 93.3% |
| Interquartile 75% (IQ3) | 93.6% | 96.5% |
| Interquartile Range (IQR) | 4.5% | 3.2% |
| Standard Deviation (Sample) | 8.2% | 3.3% |
| Standard Deviation (Population) | 8.1% | 3.3% |
Similar Demographics by 12th Grade, No Diploma
Demographics Similar to Cree by 12th Grade, No Diploma
In terms of 12th grade, no diploma, the demographic groups most similar to Cree are Hmong (91.3%, a difference of 0.010%), Immigrants from Malaysia (91.3%, a difference of 0.010%), Alsatian (91.3%, a difference of 0.020%), Immigrants from Indonesia (91.2%, a difference of 0.030%), and Immigrants from China (91.3%, a difference of 0.050%).
| Demographics | Rating | Rank | 12th Grade, No Diploma |
| Immigrants | Hong Kong | 63.8 /100 | #161 | Good 91.3% |
| Brazilians | 62.0 /100 | #162 | Good 91.3% |
| Immigrants | Asia | 61.5 /100 | #163 | Good 91.3% |
| Immigrants | China | 60.9 /100 | #164 | Good 91.3% |
| Alsatians | 58.3 /100 | #165 | Average 91.3% |
| Hmong | 58.0 /100 | #166 | Average 91.3% |
| Immigrants | Malaysia | 57.8 /100 | #167 | Average 91.3% |
| Cree | 57.0 /100 | #168 | Average 91.2% |
| Immigrants | Indonesia | 54.9 /100 | #169 | Average 91.2% |
| Delaware | 52.8 /100 | #170 | Average 91.2% |
| Immigrants | Morocco | 51.4 /100 | #171 | Average 91.2% |
| Bermudans | 50.8 /100 | #172 | Average 91.2% |
| Bolivians | 50.4 /100 | #173 | Average 91.2% |
| Immigrants | Nepal | 50.0 /100 | #174 | Average 91.2% |
| Immigrants | Western Asia | 49.0 /100 | #175 | Average 91.2% |
Demographics Similar to Croatians by 12th Grade, No Diploma
In terms of 12th grade, no diploma, the demographic groups most similar to Croatians are Latvian (93.6%, a difference of 0.020%), Slovak (93.6%, a difference of 0.030%), Chinese (93.6%, a difference of 0.030%), Polish (93.5%, a difference of 0.060%), and Eastern European (93.5%, a difference of 0.060%).
| Demographics | Rating | Rank | 12th Grade, No Diploma |
| Lithuanians | 100.0 /100 | #3 | Exceptional 93.6% |
| Slovenes | 100.0 /100 | #4 | Exceptional 93.6% |
| Carpatho Rusyns | 100.0 /100 | #5 | Exceptional 93.6% |
| Immigrants | India | 100.0 /100 | #6 | Exceptional 93.6% |
| Slovaks | 100.0 /100 | #7 | Exceptional 93.6% |
| Chinese | 100.0 /100 | #8 | Exceptional 93.6% |
| Latvians | 100.0 /100 | #9 | Exceptional 93.6% |
| Croatians | 100.0 /100 | #10 | Exceptional 93.5% |
| Poles | 100.0 /100 | #11 | Exceptional 93.5% |
| Eastern Europeans | 100.0 /100 | #12 | Exceptional 93.5% |
| Danes | 100.0 /100 | #13 | Exceptional 93.5% |
| Bulgarians | 100.0 /100 | #14 | Exceptional 93.5% |
| Finns | 100.0 /100 | #15 | Exceptional 93.4% |
| Maltese | 100.0 /100 | #16 | Exceptional 93.3% |
| Luxembourgers | 100.0 /100 | #17 | Exceptional 93.3% |