Comanche vs Cajun Female Poverty Among 25-34 Year Olds
COMPARE
Comanche
Cajun
Female Poverty Among 25-34 Year Olds
Female Poverty Among 25-34 Year Olds Comparison
Comanche
Cajuns
16.5%
FEMALE POVERTY AMONG 25-34 YEAR OLDS
0.0/ 100
METRIC RATING
291st/ 347
METRIC RANK
19.9%
FEMALE POVERTY AMONG 25-34 YEAR OLDS
0.0/ 100
METRIC RATING
333rd/ 347
METRIC RANK
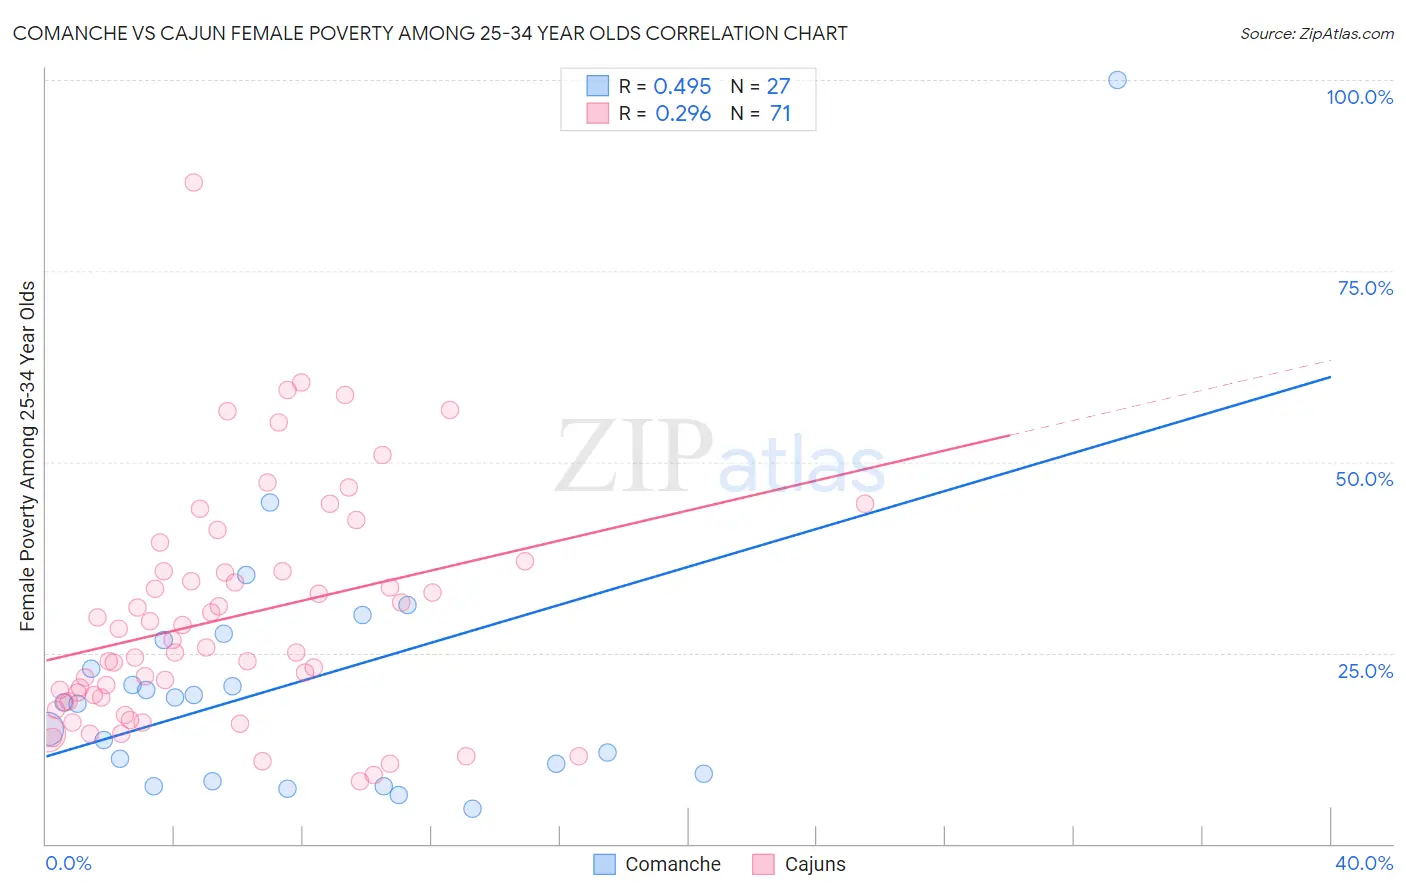
Comanche vs Cajun Female Poverty Among 25-34 Year Olds Correlation Chart
The statistical analysis conducted on geographies consisting of 109,487,317 people shows a moderate positive correlation between the proportion of Comanche and poverty level among females between the ages 25 and 34 in the United States with a correlation coefficient (R) of 0.495 and weighted average of 16.5%. Similarly, the statistical analysis conducted on geographies consisting of 148,590,525 people shows a weak positive correlation between the proportion of Cajuns and poverty level among females between the ages 25 and 34 in the United States with a correlation coefficient (R) of 0.296 and weighted average of 19.9%, a difference of 21.1%.
Female Poverty Among 25-34 Year Olds Correlation Summary
| Measurement | Comanche | Cajun |
| Minimum | 4.5% | 8.2% |
| Maximum | 100.0% | 86.6% |
| Range | 95.5% | 78.4% |
| Mean | 21.0% | 29.6% |
| Median | 18.5% | 25.7% |
| Interquartile 25% (IQ1) | 9.1% | 18.6% |
| Interquartile 75% (IQ3) | 26.7% | 35.7% |
| Interquartile Range (IQR) | 17.6% | 17.1% |
| Standard Deviation (Sample) | 18.6% | 15.1% |
| Standard Deviation (Population) | 18.3% | 15.0% |
Similar Demographics by Female Poverty Among 25-34 Year Olds
Demographics Similar to Comanche by Female Poverty Among 25-34 Year Olds
In terms of female poverty among 25-34 year olds, the demographic groups most similar to Comanche are Immigrants from Dominica (16.5%, a difference of 0.010%), Indonesian (16.4%, a difference of 0.28%), Potawatomi (16.5%, a difference of 0.28%), Osage (16.4%, a difference of 0.44%), and Guatemalan (16.4%, a difference of 0.50%).
| Demographics | Rating | Rank | Female Poverty Among 25-34 Year Olds |
| Shoshone | 0.0 /100 | #284 | Tragic 16.2% |
| Immigrants | Bahamas | 0.0 /100 | #285 | Tragic 16.3% |
| Cape Verdeans | 0.0 /100 | #286 | Tragic 16.3% |
| Americans | 0.0 /100 | #287 | Tragic 16.4% |
| Guatemalans | 0.0 /100 | #288 | Tragic 16.4% |
| Osage | 0.0 /100 | #289 | Tragic 16.4% |
| Indonesians | 0.0 /100 | #290 | Tragic 16.4% |
| Comanche | 0.0 /100 | #291 | Tragic 16.5% |
| Immigrants | Dominica | 0.0 /100 | #292 | Tragic 16.5% |
| Potawatomi | 0.0 /100 | #293 | Tragic 16.5% |
| Immigrants | Central America | 0.0 /100 | #294 | Tragic 16.6% |
| Mexicans | 0.0 /100 | #295 | Tragic 16.6% |
| Hispanics or Latinos | 0.0 /100 | #296 | Tragic 16.6% |
| Immigrants | Guatemala | 0.0 /100 | #297 | Tragic 16.6% |
| Blackfeet | 0.0 /100 | #298 | Tragic 16.7% |
Demographics Similar to Cajuns by Female Poverty Among 25-34 Year Olds
In terms of female poverty among 25-34 year olds, the demographic groups most similar to Cajuns are Apache (20.1%, a difference of 0.68%), Immigrants from Yemen (19.8%, a difference of 0.80%), Kiowa (19.7%, a difference of 1.4%), Native/Alaskan (20.3%, a difference of 1.8%), and Paiute (19.6%, a difference of 1.8%).
| Demographics | Rating | Rank | Female Poverty Among 25-34 Year Olds |
| Blacks/African Americans | 0.0 /100 | #326 | Tragic 18.9% |
| Cheyenne | 0.0 /100 | #327 | Tragic 19.1% |
| Alaskan Athabascans | 0.0 /100 | #328 | Tragic 19.1% |
| Creek | 0.0 /100 | #329 | Tragic 19.2% |
| Paiute | 0.0 /100 | #330 | Tragic 19.6% |
| Kiowa | 0.0 /100 | #331 | Tragic 19.7% |
| Immigrants | Yemen | 0.0 /100 | #332 | Tragic 19.8% |
| Cajuns | 0.0 /100 | #333 | Tragic 19.9% |
| Apache | 0.0 /100 | #334 | Tragic 20.1% |
| Natives/Alaskans | 0.0 /100 | #335 | Tragic 20.3% |
| Pueblo | 0.0 /100 | #336 | Tragic 22.2% |
| Crow | 0.0 /100 | #337 | Tragic 22.7% |
| Houma | 0.0 /100 | #338 | Tragic 22.7% |
| Yuman | 0.0 /100 | #339 | Tragic 22.9% |
| Sioux | 0.0 /100 | #340 | Tragic 23.0% |