Colville vs Immigrants from Bosnia and Herzegovina Female Poverty Among 18-24 Year Olds
COMPARE
Colville
Immigrants from Bosnia and Herzegovina
Female Poverty Among 18-24 Year Olds
Female Poverty Among 18-24 Year Olds Comparison
Colville
Immigrants from Bosnia and Herzegovina
29.0%
FEMALE POVERTY AMONG 18-24 YEAR OLDS
0.0/ 100
METRIC RATING
341st/ 347
METRIC RANK
19.7%
FEMALE POVERTY AMONG 18-24 YEAR OLDS
83.6/ 100
METRIC RATING
146th/ 347
METRIC RANK
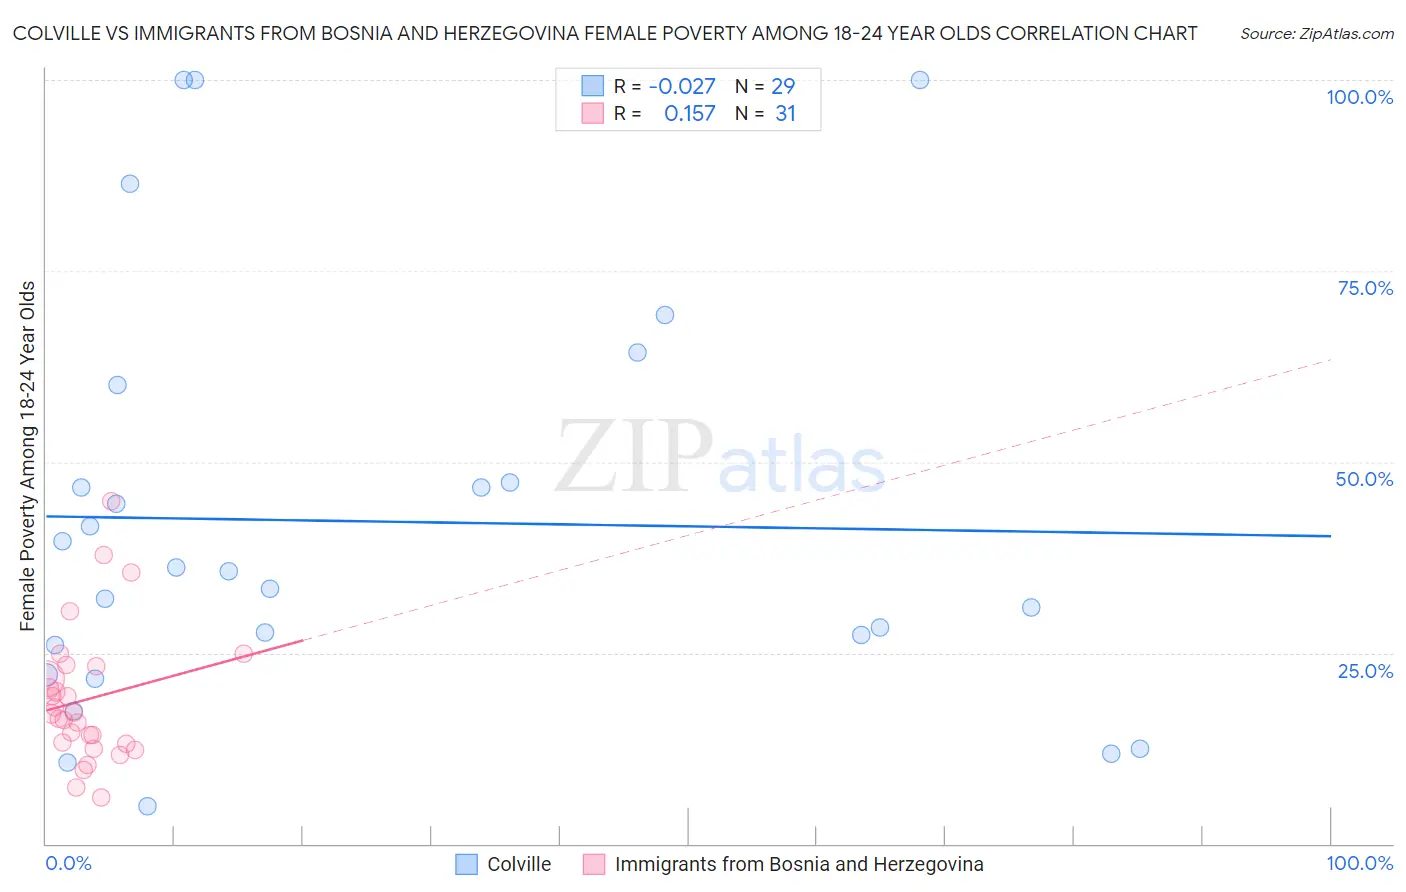
Colville vs Immigrants from Bosnia and Herzegovina Female Poverty Among 18-24 Year Olds Correlation Chart
The statistical analysis conducted on geographies consisting of 34,585,372 people shows no correlation between the proportion of Colville and poverty level among females between the ages 18 and 24 in the United States with a correlation coefficient (R) of -0.027 and weighted average of 29.0%. Similarly, the statistical analysis conducted on geographies consisting of 155,470,842 people shows a poor positive correlation between the proportion of Immigrants from Bosnia and Herzegovina and poverty level among females between the ages 18 and 24 in the United States with a correlation coefficient (R) of 0.157 and weighted average of 19.7%, a difference of 47.3%.
Female Poverty Among 18-24 Year Olds Correlation Summary
| Measurement | Colville | Immigrants from Bosnia and Herzegovina |
| Minimum | 4.9% | 6.0% |
| Maximum | 100.0% | 44.9% |
| Range | 95.1% | 38.8% |
| Mean | 42.2% | 18.9% |
| Median | 35.6% | 17.1% |
| Interquartile 25% (IQ1) | 24.1% | 13.1% |
| Interquartile 75% (IQ3) | 53.6% | 23.2% |
| Interquartile Range (IQR) | 29.6% | 10.1% |
| Standard Deviation (Sample) | 27.1% | 8.8% |
| Standard Deviation (Population) | 26.6% | 8.6% |
Similar Demographics by Female Poverty Among 18-24 Year Olds
Demographics Similar to Colville by Female Poverty Among 18-24 Year Olds
In terms of female poverty among 18-24 year olds, the demographic groups most similar to Colville are Kiowa (29.2%, a difference of 0.74%), Sioux (28.6%, a difference of 1.6%), Pima (28.4%, a difference of 2.1%), Puerto Rican (29.8%, a difference of 2.8%), and Hopi (28.2%, a difference of 2.9%).
| Demographics | Rating | Rank | Female Poverty Among 18-24 Year Olds |
| Apache | 0.0 /100 | #333 | Tragic 26.3% |
| Pueblo | 0.0 /100 | #334 | Tragic 26.9% |
| Yup'ik | 0.0 /100 | #335 | Tragic 27.0% |
| Immigrants | Yemen | 0.0 /100 | #336 | Tragic 27.5% |
| Cheyenne | 0.0 /100 | #337 | Tragic 28.1% |
| Hopi | 0.0 /100 | #338 | Tragic 28.2% |
| Pima | 0.0 /100 | #339 | Tragic 28.4% |
| Sioux | 0.0 /100 | #340 | Tragic 28.6% |
| Colville | 0.0 /100 | #341 | Tragic 29.0% |
| Kiowa | 0.0 /100 | #342 | Tragic 29.2% |
| Puerto Ricans | 0.0 /100 | #343 | Tragic 29.8% |
| Navajo | 0.0 /100 | #344 | Tragic 30.3% |
| Tohono O'odham | 0.0 /100 | #345 | Tragic 31.0% |
| Lumbee | 0.0 /100 | #346 | Tragic 31.1% |
| Crow | 0.0 /100 | #347 | Tragic 33.2% |
Demographics Similar to Immigrants from Bosnia and Herzegovina by Female Poverty Among 18-24 Year Olds
In terms of female poverty among 18-24 year olds, the demographic groups most similar to Immigrants from Bosnia and Herzegovina are Canadian (19.7%, a difference of 0.020%), Immigrants from Northern Africa (19.7%, a difference of 0.050%), Immigrants from Austria (19.7%, a difference of 0.050%), Slavic (19.7%, a difference of 0.080%), and Panamanian (19.7%, a difference of 0.090%).
| Demographics | Rating | Rank | Female Poverty Among 18-24 Year Olds |
| Indians (Asian) | 88.3 /100 | #139 | Excellent 19.6% |
| Immigrants | Trinidad and Tobago | 85.6 /100 | #140 | Excellent 19.7% |
| Pennsylvania Germans | 85.5 /100 | #141 | Excellent 19.7% |
| Panamanians | 84.6 /100 | #142 | Excellent 19.7% |
| Slavs | 84.4 /100 | #143 | Excellent 19.7% |
| Immigrants | Northern Africa | 84.1 /100 | #144 | Excellent 19.7% |
| Canadians | 83.8 /100 | #145 | Excellent 19.7% |
| Immigrants | Bosnia and Herzegovina | 83.6 /100 | #146 | Excellent 19.7% |
| Immigrants | Austria | 83.1 /100 | #147 | Excellent 19.7% |
| Immigrants | Latin America | 81.3 /100 | #148 | Excellent 19.7% |
| Immigrants | Oceania | 81.2 /100 | #149 | Excellent 19.7% |
| Syrians | 80.2 /100 | #150 | Excellent 19.8% |
| Immigrants | Eastern Asia | 79.7 /100 | #151 | Good 19.8% |
| Yugoslavians | 79.0 /100 | #152 | Good 19.8% |
| Immigrants | Japan | 78.1 /100 | #153 | Good 19.8% |