Colville vs Slovene Female Poverty Among 18-24 Year Olds
COMPARE
Colville
Slovene
Female Poverty Among 18-24 Year Olds
Female Poverty Among 18-24 Year Olds Comparison
Colville
Slovenes
29.0%
FEMALE POVERTY AMONG 18-24 YEAR OLDS
0.0/ 100
METRIC RATING
341st/ 347
METRIC RANK
19.3%
FEMALE POVERTY AMONG 18-24 YEAR OLDS
96.2/ 100
METRIC RATING
114th/ 347
METRIC RANK
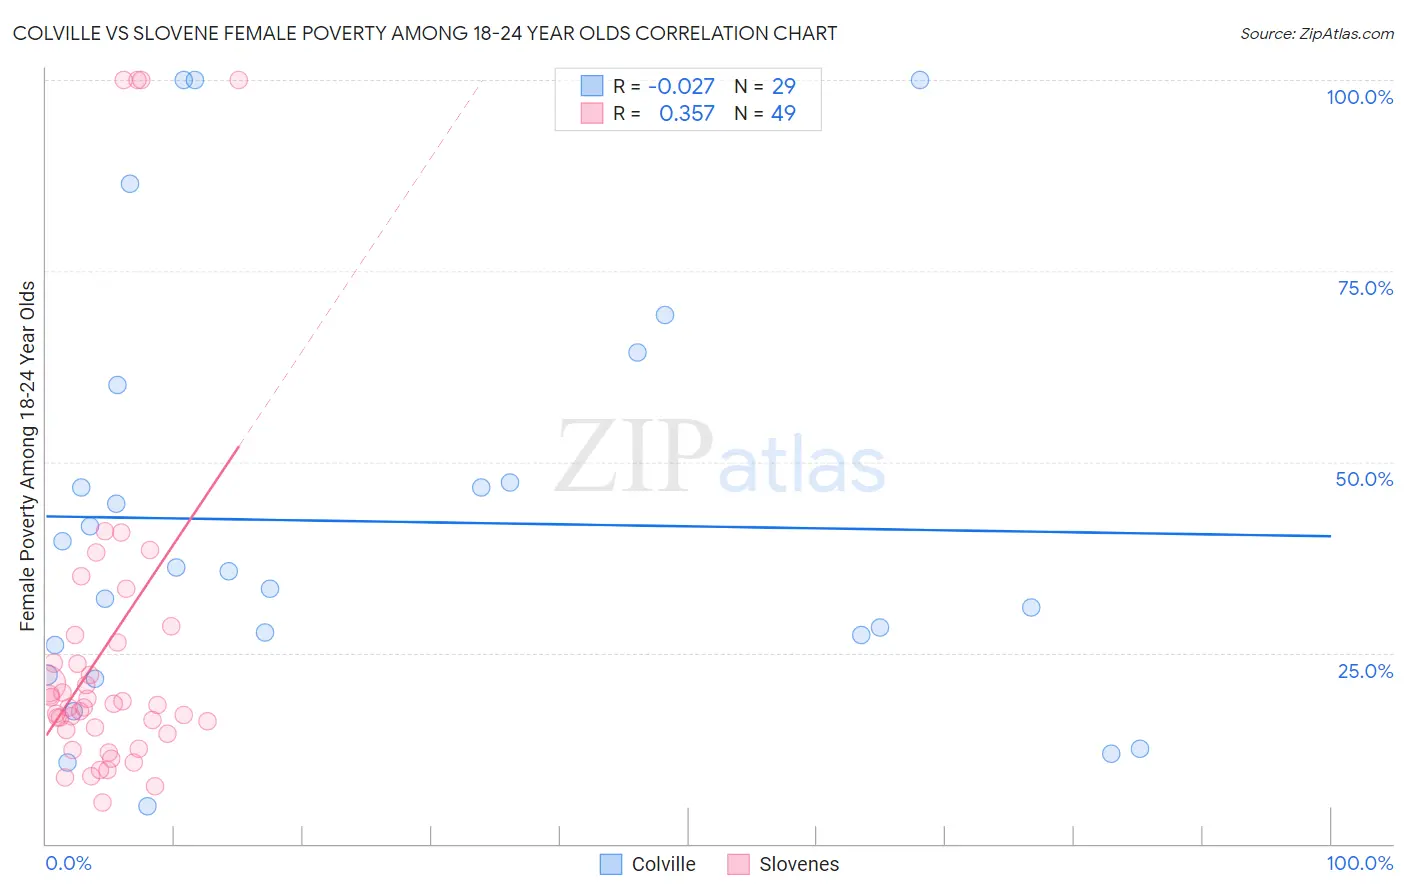
Colville vs Slovene Female Poverty Among 18-24 Year Olds Correlation Chart
The statistical analysis conducted on geographies consisting of 34,585,372 people shows no correlation between the proportion of Colville and poverty level among females between the ages 18 and 24 in the United States with a correlation coefficient (R) of -0.027 and weighted average of 29.0%. Similarly, the statistical analysis conducted on geographies consisting of 255,615,835 people shows a mild positive correlation between the proportion of Slovenes and poverty level among females between the ages 18 and 24 in the United States with a correlation coefficient (R) of 0.357 and weighted average of 19.3%, a difference of 50.3%.
Female Poverty Among 18-24 Year Olds Correlation Summary
| Measurement | Colville | Slovene |
| Minimum | 4.9% | 5.4% |
| Maximum | 100.0% | 100.0% |
| Range | 95.1% | 94.6% |
| Mean | 42.2% | 26.0% |
| Median | 35.6% | 18.2% |
| Interquartile 25% (IQ1) | 24.1% | 14.6% |
| Interquartile 75% (IQ3) | 53.6% | 26.8% |
| Interquartile Range (IQR) | 29.6% | 12.2% |
| Standard Deviation (Sample) | 27.1% | 23.9% |
| Standard Deviation (Population) | 26.6% | 23.6% |
Similar Demographics by Female Poverty Among 18-24 Year Olds
Demographics Similar to Colville by Female Poverty Among 18-24 Year Olds
In terms of female poverty among 18-24 year olds, the demographic groups most similar to Colville are Kiowa (29.2%, a difference of 0.74%), Sioux (28.6%, a difference of 1.6%), Pima (28.4%, a difference of 2.1%), Puerto Rican (29.8%, a difference of 2.8%), and Hopi (28.2%, a difference of 2.9%).
| Demographics | Rating | Rank | Female Poverty Among 18-24 Year Olds |
| Apache | 0.0 /100 | #333 | Tragic 26.3% |
| Pueblo | 0.0 /100 | #334 | Tragic 26.9% |
| Yup'ik | 0.0 /100 | #335 | Tragic 27.0% |
| Immigrants | Yemen | 0.0 /100 | #336 | Tragic 27.5% |
| Cheyenne | 0.0 /100 | #337 | Tragic 28.1% |
| Hopi | 0.0 /100 | #338 | Tragic 28.2% |
| Pima | 0.0 /100 | #339 | Tragic 28.4% |
| Sioux | 0.0 /100 | #340 | Tragic 28.6% |
| Colville | 0.0 /100 | #341 | Tragic 29.0% |
| Kiowa | 0.0 /100 | #342 | Tragic 29.2% |
| Puerto Ricans | 0.0 /100 | #343 | Tragic 29.8% |
| Navajo | 0.0 /100 | #344 | Tragic 30.3% |
| Tohono O'odham | 0.0 /100 | #345 | Tragic 31.0% |
| Lumbee | 0.0 /100 | #346 | Tragic 31.1% |
| Crow | 0.0 /100 | #347 | Tragic 33.2% |
Demographics Similar to Slovenes by Female Poverty Among 18-24 Year Olds
In terms of female poverty among 18-24 year olds, the demographic groups most similar to Slovenes are Immigrants from Hungary (19.3%, a difference of 0.010%), Immigrants from Cameroon (19.3%, a difference of 0.040%), Immigrants from El Salvador (19.3%, a difference of 0.10%), Immigrants (19.3%, a difference of 0.11%), and Immigrants from Iran (19.3%, a difference of 0.15%).
| Demographics | Rating | Rank | Female Poverty Among 18-24 Year Olds |
| Immigrants | Sri Lanka | 97.5 /100 | #107 | Exceptional 19.2% |
| Immigrants | Uzbekistan | 97.3 /100 | #108 | Exceptional 19.2% |
| Immigrants | Syria | 97.2 /100 | #109 | Exceptional 19.2% |
| Laotians | 97.1 /100 | #110 | Exceptional 19.2% |
| Immigrants | Serbia | 97.1 /100 | #111 | Exceptional 19.2% |
| Immigrants | El Salvador | 96.5 /100 | #112 | Exceptional 19.3% |
| Immigrants | Cameroon | 96.3 /100 | #113 | Exceptional 19.3% |
| Slovenes | 96.2 /100 | #114 | Exceptional 19.3% |
| Immigrants | Hungary | 96.2 /100 | #115 | Exceptional 19.3% |
| Immigrants | Immigrants | 95.9 /100 | #116 | Exceptional 19.3% |
| Immigrants | Iran | 95.8 /100 | #117 | Exceptional 19.3% |
| Immigrants | Guyana | 95.6 /100 | #118 | Exceptional 19.3% |
| Cypriots | 95.5 /100 | #119 | Exceptional 19.3% |
| Immigrants | Northern Europe | 95.4 /100 | #120 | Exceptional 19.4% |
| Guyanese | 95.3 /100 | #121 | Exceptional 19.4% |