Colville vs Immigrants from Australia Female Poverty Among 18-24 Year Olds
COMPARE
Colville
Immigrants from Australia
Female Poverty Among 18-24 Year Olds
Female Poverty Among 18-24 Year Olds Comparison
Colville
Immigrants from Australia
29.0%
FEMALE POVERTY AMONG 18-24 YEAR OLDS
0.0/ 100
METRIC RATING
341st/ 347
METRIC RANK
20.9%
FEMALE POVERTY AMONG 18-24 YEAR OLDS
3.1/ 100
METRIC RATING
246th/ 347
METRIC RANK
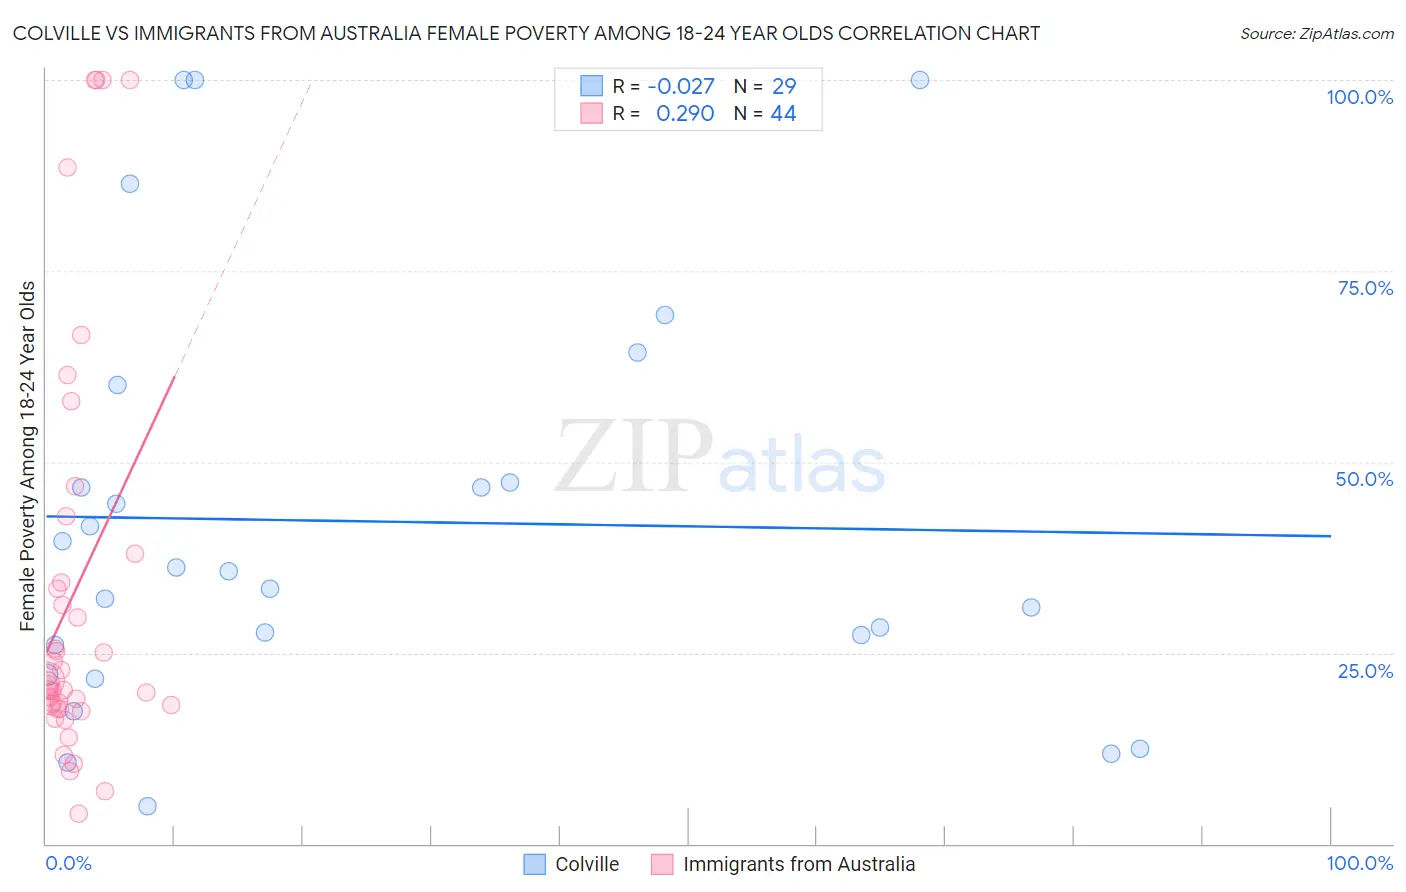
Colville vs Immigrants from Australia Female Poverty Among 18-24 Year Olds Correlation Chart
The statistical analysis conducted on geographies consisting of 34,585,372 people shows no correlation between the proportion of Colville and poverty level among females between the ages 18 and 24 in the United States with a correlation coefficient (R) of -0.027 and weighted average of 29.0%. Similarly, the statistical analysis conducted on geographies consisting of 223,617,185 people shows a weak positive correlation between the proportion of Immigrants from Australia and poverty level among females between the ages 18 and 24 in the United States with a correlation coefficient (R) of 0.290 and weighted average of 20.9%, a difference of 38.5%.
Female Poverty Among 18-24 Year Olds Correlation Summary
| Measurement | Colville | Immigrants from Australia |
| Minimum | 4.9% | 4.0% |
| Maximum | 100.0% | 100.0% |
| Range | 95.1% | 96.0% |
| Mean | 42.2% | 32.9% |
| Median | 35.6% | 20.9% |
| Interquartile 25% (IQ1) | 24.1% | 17.8% |
| Interquartile 75% (IQ3) | 53.6% | 36.1% |
| Interquartile Range (IQR) | 29.6% | 18.2% |
| Standard Deviation (Sample) | 27.1% | 27.0% |
| Standard Deviation (Population) | 26.6% | 26.7% |
Similar Demographics by Female Poverty Among 18-24 Year Olds
Demographics Similar to Colville by Female Poverty Among 18-24 Year Olds
In terms of female poverty among 18-24 year olds, the demographic groups most similar to Colville are Kiowa (29.2%, a difference of 0.74%), Sioux (28.6%, a difference of 1.6%), Pima (28.4%, a difference of 2.1%), Puerto Rican (29.8%, a difference of 2.8%), and Hopi (28.2%, a difference of 2.9%).
| Demographics | Rating | Rank | Female Poverty Among 18-24 Year Olds |
| Apache | 0.0 /100 | #333 | Tragic 26.3% |
| Pueblo | 0.0 /100 | #334 | Tragic 26.9% |
| Yup'ik | 0.0 /100 | #335 | Tragic 27.0% |
| Immigrants | Yemen | 0.0 /100 | #336 | Tragic 27.5% |
| Cheyenne | 0.0 /100 | #337 | Tragic 28.1% |
| Hopi | 0.0 /100 | #338 | Tragic 28.2% |
| Pima | 0.0 /100 | #339 | Tragic 28.4% |
| Sioux | 0.0 /100 | #340 | Tragic 28.6% |
| Colville | 0.0 /100 | #341 | Tragic 29.0% |
| Kiowa | 0.0 /100 | #342 | Tragic 29.2% |
| Puerto Ricans | 0.0 /100 | #343 | Tragic 29.8% |
| Navajo | 0.0 /100 | #344 | Tragic 30.3% |
| Tohono O'odham | 0.0 /100 | #345 | Tragic 31.0% |
| Lumbee | 0.0 /100 | #346 | Tragic 31.1% |
| Crow | 0.0 /100 | #347 | Tragic 33.2% |
Demographics Similar to Immigrants from Australia by Female Poverty Among 18-24 Year Olds
In terms of female poverty among 18-24 year olds, the demographic groups most similar to Immigrants from Australia are Immigrants from Africa (21.0%, a difference of 0.060%), Aleut (20.9%, a difference of 0.080%), Immigrants from Thailand (20.9%, a difference of 0.11%), Marshallese (20.9%, a difference of 0.12%), and Immigrants from Kenya (21.0%, a difference of 0.25%).
| Demographics | Rating | Rank | Female Poverty Among 18-24 Year Olds |
| Immigrants | Guatemala | 4.3 /100 | #239 | Tragic 20.9% |
| Luxembourgers | 4.2 /100 | #240 | Tragic 20.9% |
| Immigrants | Eritrea | 4.2 /100 | #241 | Tragic 20.9% |
| Israelis | 4.1 /100 | #242 | Tragic 20.9% |
| Marshallese | 3.4 /100 | #243 | Tragic 20.9% |
| Immigrants | Thailand | 3.4 /100 | #244 | Tragic 20.9% |
| Aleuts | 3.3 /100 | #245 | Tragic 20.9% |
| Immigrants | Australia | 3.1 /100 | #246 | Tragic 20.9% |
| Immigrants | Africa | 3.0 /100 | #247 | Tragic 21.0% |
| Immigrants | Kenya | 2.5 /100 | #248 | Tragic 21.0% |
| Carpatho Rusyns | 2.5 /100 | #249 | Tragic 21.0% |
| Immigrants | West Indies | 2.2 /100 | #250 | Tragic 21.0% |
| West Indians | 1.9 /100 | #251 | Tragic 21.1% |
| South Africans | 1.6 /100 | #252 | Tragic 21.1% |
| Delaware | 1.6 /100 | #253 | Tragic 21.1% |