Carpatho Rusyn vs Immigrants from Bosnia and Herzegovina Female Poverty Among 18-24 Year Olds
COMPARE
Carpatho Rusyn
Immigrants from Bosnia and Herzegovina
Female Poverty Among 18-24 Year Olds
Female Poverty Among 18-24 Year Olds Comparison
Carpatho Rusyns
Immigrants from Bosnia and Herzegovina
21.0%
FEMALE POVERTY AMONG 18-24 YEAR OLDS
2.5/ 100
METRIC RATING
249th/ 347
METRIC RANK
19.7%
FEMALE POVERTY AMONG 18-24 YEAR OLDS
83.6/ 100
METRIC RATING
146th/ 347
METRIC RANK
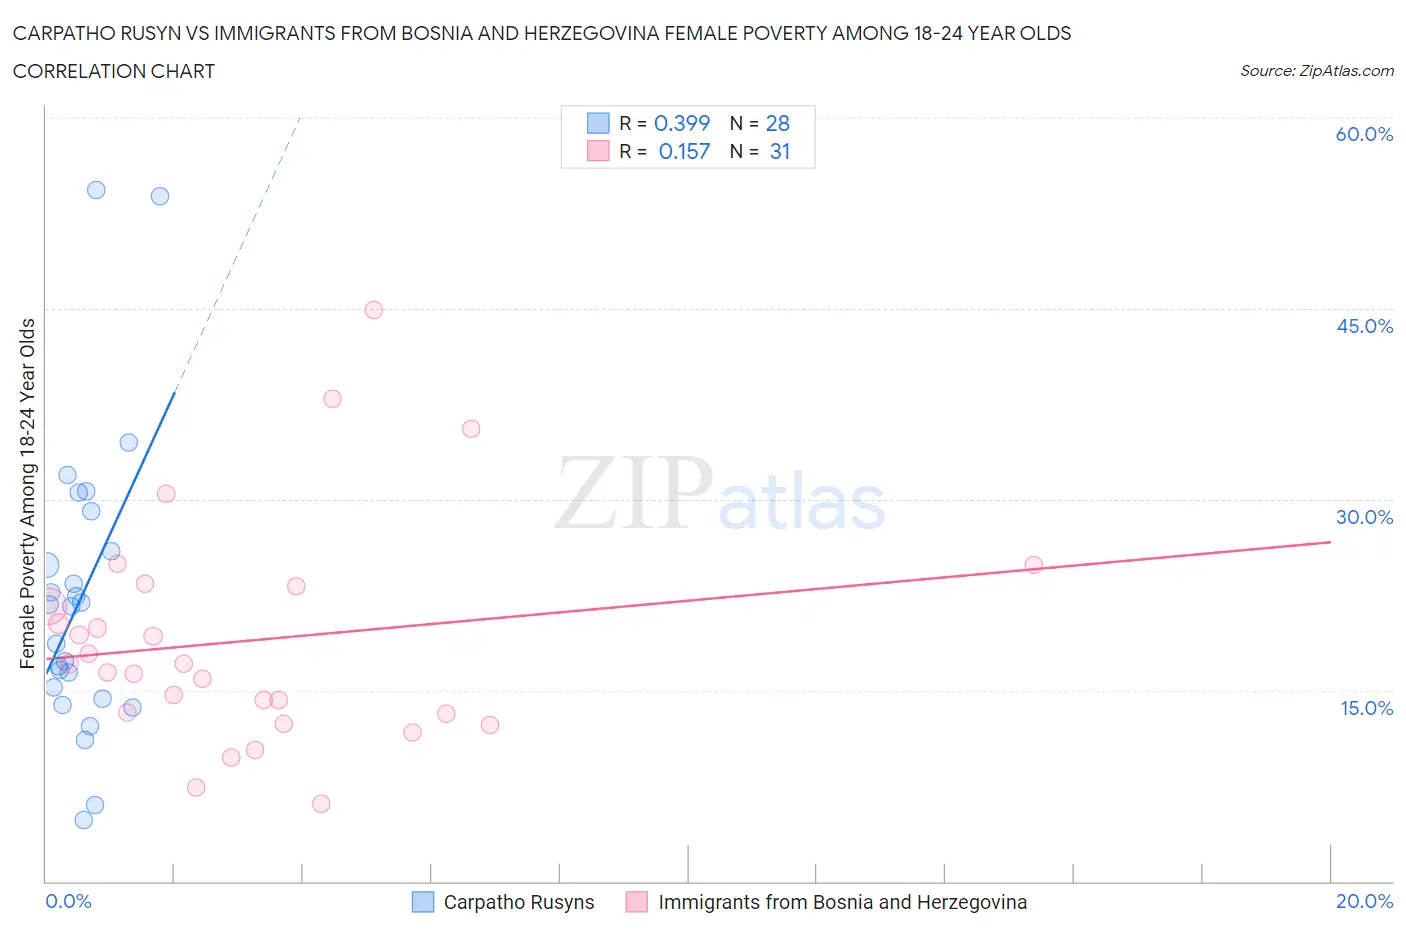
Carpatho Rusyn vs Immigrants from Bosnia and Herzegovina Female Poverty Among 18-24 Year Olds Correlation Chart
The statistical analysis conducted on geographies consisting of 58,245,261 people shows a mild positive correlation between the proportion of Carpatho Rusyns and poverty level among females between the ages 18 and 24 in the United States with a correlation coefficient (R) of 0.399 and weighted average of 21.0%. Similarly, the statistical analysis conducted on geographies consisting of 155,470,842 people shows a poor positive correlation between the proportion of Immigrants from Bosnia and Herzegovina and poverty level among females between the ages 18 and 24 in the United States with a correlation coefficient (R) of 0.157 and weighted average of 19.7%, a difference of 6.6%.
Female Poverty Among 18-24 Year Olds Correlation Summary
| Measurement | Carpatho Rusyn | Immigrants from Bosnia and Herzegovina |
| Minimum | 4.8% | 6.0% |
| Maximum | 54.3% | 44.9% |
| Range | 49.4% | 38.8% |
| Mean | 22.4% | 18.9% |
| Median | 21.6% | 17.1% |
| Interquartile 25% (IQ1) | 14.8% | 13.1% |
| Interquartile 75% (IQ3) | 27.5% | 23.2% |
| Interquartile Range (IQR) | 12.7% | 10.1% |
| Standard Deviation (Sample) | 11.6% | 8.8% |
| Standard Deviation (Population) | 11.4% | 8.6% |
Similar Demographics by Female Poverty Among 18-24 Year Olds
Demographics Similar to Carpatho Rusyns by Female Poverty Among 18-24 Year Olds
In terms of female poverty among 18-24 year olds, the demographic groups most similar to Carpatho Rusyns are Immigrants from Kenya (21.0%, a difference of 0.020%), Immigrants from West Indies (21.0%, a difference of 0.13%), Immigrants from Africa (21.0%, a difference of 0.22%), Immigrants from Australia (20.9%, a difference of 0.27%), and West Indian (21.1%, a difference of 0.33%).
| Demographics | Rating | Rank | Female Poverty Among 18-24 Year Olds |
| Israelis | 4.1 /100 | #242 | Tragic 20.9% |
| Marshallese | 3.4 /100 | #243 | Tragic 20.9% |
| Immigrants | Thailand | 3.4 /100 | #244 | Tragic 20.9% |
| Aleuts | 3.3 /100 | #245 | Tragic 20.9% |
| Immigrants | Australia | 3.1 /100 | #246 | Tragic 20.9% |
| Immigrants | Africa | 3.0 /100 | #247 | Tragic 21.0% |
| Immigrants | Kenya | 2.5 /100 | #248 | Tragic 21.0% |
| Carpatho Rusyns | 2.5 /100 | #249 | Tragic 21.0% |
| Immigrants | West Indies | 2.2 /100 | #250 | Tragic 21.0% |
| West Indians | 1.9 /100 | #251 | Tragic 21.1% |
| South Africans | 1.6 /100 | #252 | Tragic 21.1% |
| Delaware | 1.6 /100 | #253 | Tragic 21.1% |
| British West Indians | 1.2 /100 | #254 | Tragic 21.2% |
| Immigrants | Grenada | 1.2 /100 | #255 | Tragic 21.2% |
| Tsimshian | 1.0 /100 | #256 | Tragic 21.2% |
Demographics Similar to Immigrants from Bosnia and Herzegovina by Female Poverty Among 18-24 Year Olds
In terms of female poverty among 18-24 year olds, the demographic groups most similar to Immigrants from Bosnia and Herzegovina are Canadian (19.7%, a difference of 0.020%), Immigrants from Northern Africa (19.7%, a difference of 0.050%), Immigrants from Austria (19.7%, a difference of 0.050%), Slavic (19.7%, a difference of 0.080%), and Panamanian (19.7%, a difference of 0.090%).
| Demographics | Rating | Rank | Female Poverty Among 18-24 Year Olds |
| Indians (Asian) | 88.3 /100 | #139 | Excellent 19.6% |
| Immigrants | Trinidad and Tobago | 85.6 /100 | #140 | Excellent 19.7% |
| Pennsylvania Germans | 85.5 /100 | #141 | Excellent 19.7% |
| Panamanians | 84.6 /100 | #142 | Excellent 19.7% |
| Slavs | 84.4 /100 | #143 | Excellent 19.7% |
| Immigrants | Northern Africa | 84.1 /100 | #144 | Excellent 19.7% |
| Canadians | 83.8 /100 | #145 | Excellent 19.7% |
| Immigrants | Bosnia and Herzegovina | 83.6 /100 | #146 | Excellent 19.7% |
| Immigrants | Austria | 83.1 /100 | #147 | Excellent 19.7% |
| Immigrants | Latin America | 81.3 /100 | #148 | Excellent 19.7% |
| Immigrants | Oceania | 81.2 /100 | #149 | Excellent 19.7% |
| Syrians | 80.2 /100 | #150 | Excellent 19.8% |
| Immigrants | Eastern Asia | 79.7 /100 | #151 | Good 19.8% |
| Yugoslavians | 79.0 /100 | #152 | Good 19.8% |
| Immigrants | Japan | 78.1 /100 | #153 | Good 19.8% |