Ugandan vs Immigrants from Bosnia and Herzegovina Female Poverty Among 18-24 Year Olds
COMPARE
Ugandan
Immigrants from Bosnia and Herzegovina
Female Poverty Among 18-24 Year Olds
Female Poverty Among 18-24 Year Olds Comparison
Ugandans
Immigrants from Bosnia and Herzegovina
22.1%
FEMALE POVERTY AMONG 18-24 YEAR OLDS
0.0/ 100
METRIC RATING
286th/ 347
METRIC RANK
19.7%
FEMALE POVERTY AMONG 18-24 YEAR OLDS
83.6/ 100
METRIC RATING
146th/ 347
METRIC RANK
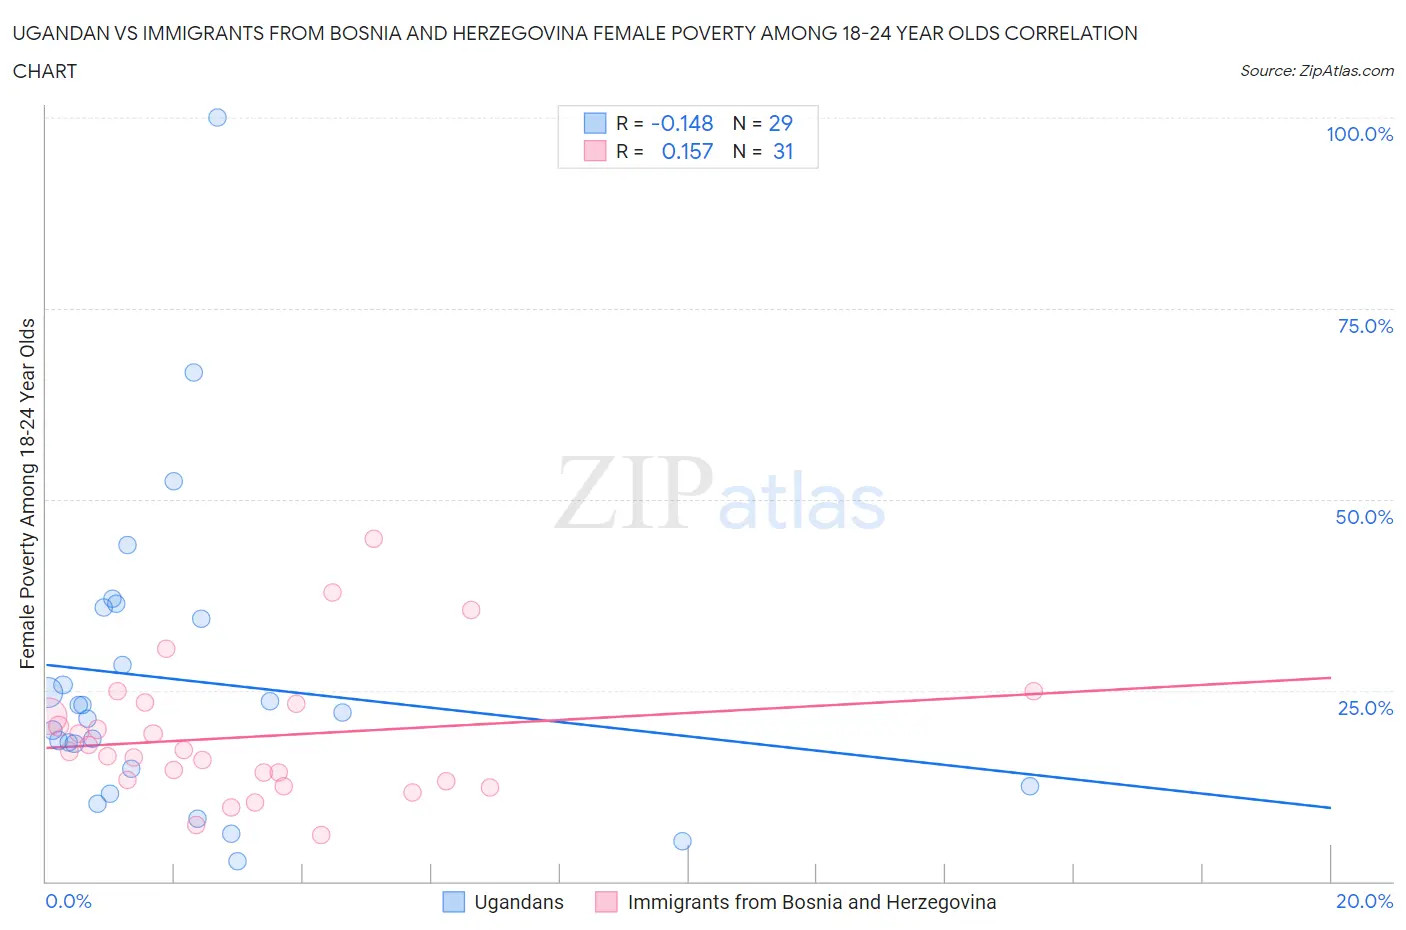
Ugandan vs Immigrants from Bosnia and Herzegovina Female Poverty Among 18-24 Year Olds Correlation Chart
The statistical analysis conducted on geographies consisting of 93,585,105 people shows a poor negative correlation between the proportion of Ugandans and poverty level among females between the ages 18 and 24 in the United States with a correlation coefficient (R) of -0.148 and weighted average of 22.1%. Similarly, the statistical analysis conducted on geographies consisting of 155,470,842 people shows a poor positive correlation between the proportion of Immigrants from Bosnia and Herzegovina and poverty level among females between the ages 18 and 24 in the United States with a correlation coefficient (R) of 0.157 and weighted average of 19.7%, a difference of 12.1%.
Female Poverty Among 18-24 Year Olds Correlation Summary
| Measurement | Ugandan | Immigrants from Bosnia and Herzegovina |
| Minimum | 2.7% | 6.0% |
| Maximum | 100.0% | 44.9% |
| Range | 97.3% | 38.8% |
| Mean | 26.3% | 18.9% |
| Median | 22.0% | 17.1% |
| Interquartile 25% (IQ1) | 13.6% | 13.1% |
| Interquartile 75% (IQ3) | 35.1% | 23.2% |
| Interquartile Range (IQR) | 21.5% | 10.1% |
| Standard Deviation (Sample) | 20.1% | 8.8% |
| Standard Deviation (Population) | 19.8% | 8.6% |
Similar Demographics by Female Poverty Among 18-24 Year Olds
Demographics Similar to Ugandans by Female Poverty Among 18-24 Year Olds
In terms of female poverty among 18-24 year olds, the demographic groups most similar to Ugandans are Immigrants from Middle Africa (22.1%, a difference of 0.010%), Ottawa (22.0%, a difference of 0.19%), Tlingit-Haida (22.0%, a difference of 0.31%), Subsaharan African (22.0%, a difference of 0.32%), and Bermudan (21.9%, a difference of 0.62%).
| Demographics | Rating | Rank | Female Poverty Among 18-24 Year Olds |
| Spanish Americans | 0.1 /100 | #279 | Tragic 21.9% |
| Immigrants | Dominica | 0.1 /100 | #280 | Tragic 21.9% |
| Immigrants | Dominican Republic | 0.1 /100 | #281 | Tragic 21.9% |
| Bermudans | 0.1 /100 | #282 | Tragic 21.9% |
| Sub-Saharan Africans | 0.0 /100 | #283 | Tragic 22.0% |
| Tlingit-Haida | 0.0 /100 | #284 | Tragic 22.0% |
| Ottawa | 0.0 /100 | #285 | Tragic 22.0% |
| Ugandans | 0.0 /100 | #286 | Tragic 22.1% |
| Immigrants | Middle Africa | 0.0 /100 | #287 | Tragic 22.1% |
| Dominicans | 0.0 /100 | #288 | Tragic 22.3% |
| French American Indians | 0.0 /100 | #289 | Tragic 22.3% |
| Immigrants | Senegal | 0.0 /100 | #290 | Tragic 22.4% |
| Bangladeshis | 0.0 /100 | #291 | Tragic 22.5% |
| Alaskan Athabascans | 0.0 /100 | #292 | Tragic 22.5% |
| U.S. Virgin Islanders | 0.0 /100 | #293 | Tragic 22.5% |
Demographics Similar to Immigrants from Bosnia and Herzegovina by Female Poverty Among 18-24 Year Olds
In terms of female poverty among 18-24 year olds, the demographic groups most similar to Immigrants from Bosnia and Herzegovina are Canadian (19.7%, a difference of 0.020%), Immigrants from Northern Africa (19.7%, a difference of 0.050%), Immigrants from Austria (19.7%, a difference of 0.050%), Slavic (19.7%, a difference of 0.080%), and Panamanian (19.7%, a difference of 0.090%).
| Demographics | Rating | Rank | Female Poverty Among 18-24 Year Olds |
| Indians (Asian) | 88.3 /100 | #139 | Excellent 19.6% |
| Immigrants | Trinidad and Tobago | 85.6 /100 | #140 | Excellent 19.7% |
| Pennsylvania Germans | 85.5 /100 | #141 | Excellent 19.7% |
| Panamanians | 84.6 /100 | #142 | Excellent 19.7% |
| Slavs | 84.4 /100 | #143 | Excellent 19.7% |
| Immigrants | Northern Africa | 84.1 /100 | #144 | Excellent 19.7% |
| Canadians | 83.8 /100 | #145 | Excellent 19.7% |
| Immigrants | Bosnia and Herzegovina | 83.6 /100 | #146 | Excellent 19.7% |
| Immigrants | Austria | 83.1 /100 | #147 | Excellent 19.7% |
| Immigrants | Latin America | 81.3 /100 | #148 | Excellent 19.7% |
| Immigrants | Oceania | 81.2 /100 | #149 | Excellent 19.7% |
| Syrians | 80.2 /100 | #150 | Excellent 19.8% |
| Immigrants | Eastern Asia | 79.7 /100 | #151 | Good 19.8% |
| Yugoslavians | 79.0 /100 | #152 | Good 19.8% |
| Immigrants | Japan | 78.1 /100 | #153 | Good 19.8% |